September 26, 2025 a 04:45 pm
KMX: Fibunacci Analysis - CarMax, Inc.
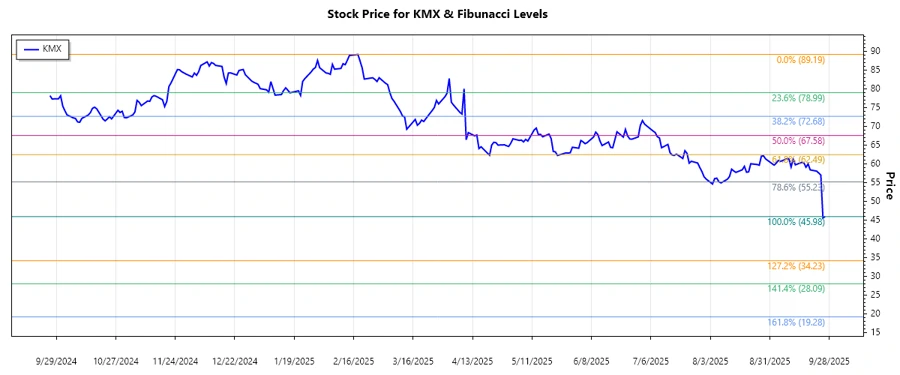
CarMax, Inc. has seen fluctuations in its stock performance with varying investor sentiment. The technical indicators show recent bearish trends, as analyzed from recent price movements. Despite strong fundamentals, short-term risks could affect momentum-based investors.
Fibunacci Analysis
| Analysis Details | Information |
|---|---|
| Start Date of Trend | 2025-02-18 |
| End Date of Trend | 2025-09-26 |
| High Price & Date | $89.19 on 2025-02-18 |
| Low Price & Date | $45.98 on 2025-09-26 |
| Fibonacci Level | Price Level |
|---|---|
| 0.236 | $59.32 |
| 0.382 | $64.29 |
| 0.5 | $67.59 |
| 0.618 | $70.89 |
| 0.786 | $75.25 |
Current price is hovering around $45.98, indicating it is below the main Fibonacci retracement levels. Hence it is not within a major retracement zone currently.
Conclusion: The existing technical indicators denote potential further declines or consolidation. The low price could act as a baseline, with possible resistances at various Fibonacci levels.
Conclusion
Given its historical retracement levels, CarMax, Inc.’s stock price appears to be in a downward trend with minimal immediate support. The market environment has been challenging with various external economic factors impacting the automotive retail sector. For potential investors, this could imply caution as the price navigates uncertified waters, however, bargain investors might see opportunity given the decline. Consistent with the identified trend, levels such as $67.59 remain significant barriers to any immediate upsides.
Smart Data Insight
Master the Perfect Entry & Exit for this Stock
Don't leave your profits to chance. Historically, this stock follows specific seasonal patterns that institutional traders use to maximize returns.
- ✅ Identify the "Golden Buying Window"
- ✅ Avoid high-risk correction cycles
- ✅ Backtested data from the last 20+ years