September 08, 2025 a 04:45 pm
KMX: Fibonacci Analysis - CarMax, Inc.
CarMax, Inc. has been navigating the challenges of the used car market with resilience. The recent downward trend in its stock price suggests a consolidation phase, which might present both buying opportunities and cautionary signals for investors. The company's strong foothold in the used vehicle sector and diversified offerings through its finance segment provide a robust base for future growth, albeit under the scrutiny of market fluctuations.
Fibonacci Analysis
| Detail | Value |
|---|---|
| Start Date | 2025-04-02 |
| End Date | 2025-09-08 |
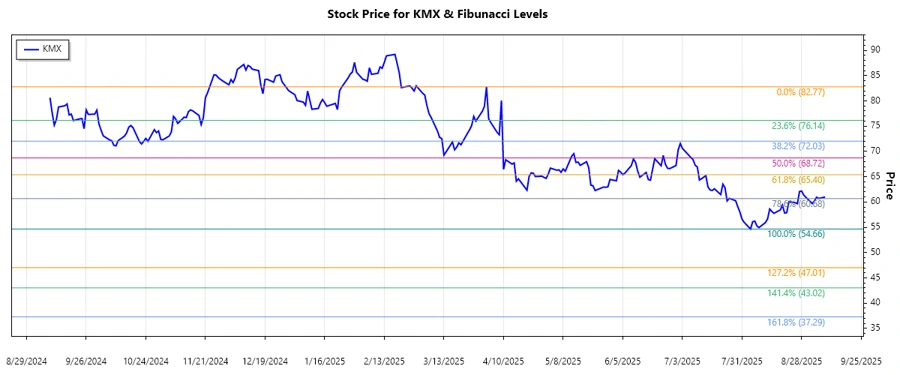
| High Price & Date | $82.77 on 2025-04-02 |
| Low Price & Date | $54.66 on 2025-08-04 |
| Fibonacci Level 0.236 | $60.41 |
| Fibonacci Level 0.382 | $64.72 |
| Fibonacci Level 0.5 | $68.72 |
| Fibonacci Level 0.618 | $72.71 |
| Fibonacci Level 0.786 | $78.21 |
| Current Price | $60.99 |
| Retracement Zone | 0.236 |
| Technical Interpretation | The stock is currently within the 0.236 retracement zone, indicating potential support around this level, possibly signalling a pause or reversal in the current trend. |
Conclusion
CarMax, Inc.'s recent downtrend suggests a potential buying opportunity for value-oriented investors, particularly as the stock finds support at critical Fibonacci levels. However, the macroeconomic environment and consumer confidence in the used car market remain pivotal to the company's short-term bullish case. Nonetheless, the company's diverse portfolio and operational strength may cushion against volatility. Analysts should monitor technical signals and market trends closely, given the potential for both rebound and continued consolidation.
Smart Data Insight
Master the Perfect Entry & Exit for this Stock
Don't leave your profits to chance. Historically, this stock follows specific seasonal patterns that institutional traders use to maximize returns.
- ✅ Identify the "Golden Buying Window"
- ✅ Avoid high-risk correction cycles
- ✅ Backtested data from the last 20+ years