August 21, 2025 a 03:15 pm
KMX: Fibonacci Analysis - CarMax, Inc.
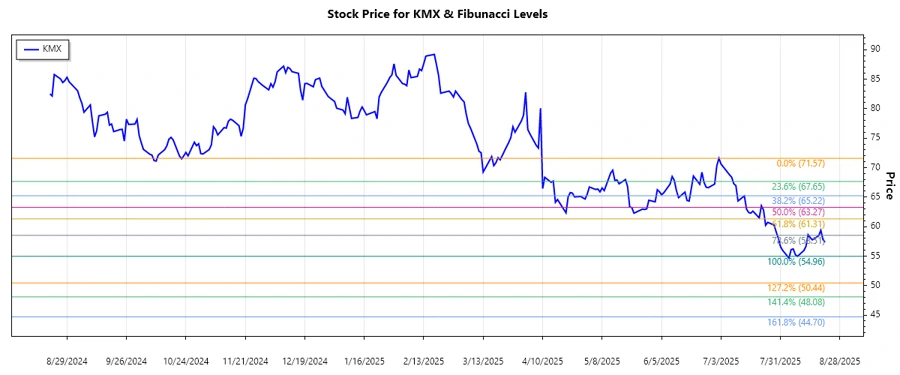
CarMax, Inc. has shown a significant shift in its stock performance over the past few months. As a key player in the used vehicle retail sector, the company's stock is susceptible to market dynamics and economic conditions. Recently, the stock experienced a downturn that might interest traders looking for potential buying opportunities at retracement levels. The following analysis explores these technical aspects.
Fibonacci Analysis
| Metrics | Details |
|---|---|
| Trend Start Date | 2025-07-02 |
| Trend End Date | 2025-08-21 |
| High Price (Date) | $71.57 (2025-07-02) |
| Low Price (Date) | $54.96 (2025-08-08) |
| Fibonacci Levels |
|
| Current Retracement Zone | 0.236 |
| Technical Interpretation | This level may act as a potential support, with the possibility of a reversal or continuation of the current trend. |
Conclusion
CarMax, Inc.'s stock has experienced a notable downward trend in the recent months, yet the emergence of potential support at Fibonacci levels offers strategic entry points for investors. The current position within the 0.236 retracement zone suggests slight support, yet investors should remain cautious, given the overall bearish trend. Long-term prospects will depend on recovery signs around pivotal Fibonacci levels. For analysts, monitoring price action in relation to these retracement levels will provide key insights into potential reversals or trend confirmations.
JSON Object:
Smart Data Insight
Master the Perfect Entry & Exit for this Stock
Don't leave your profits to chance. Historically, this stock follows specific seasonal patterns that institutional traders use to maximize returns.
- ✅ Identify the "Golden Buying Window"
- ✅ Avoid high-risk correction cycles
- ✅ Backtested data from the last 20+ years