February 09, 2026 a 05:15 am
KMB: Fibonacci Analysis - Kimberly-Clark Corporation
The stock of Kimberly-Clark (KMB) has shown varied performance over recent months. The technical analysis suggests a broad downturn movement from its previous highs. As the company continues to navigate challenges within its market, understanding the support and resistance levels will be crucial for potential investors and stakeholders.
Fibonacci Analysis
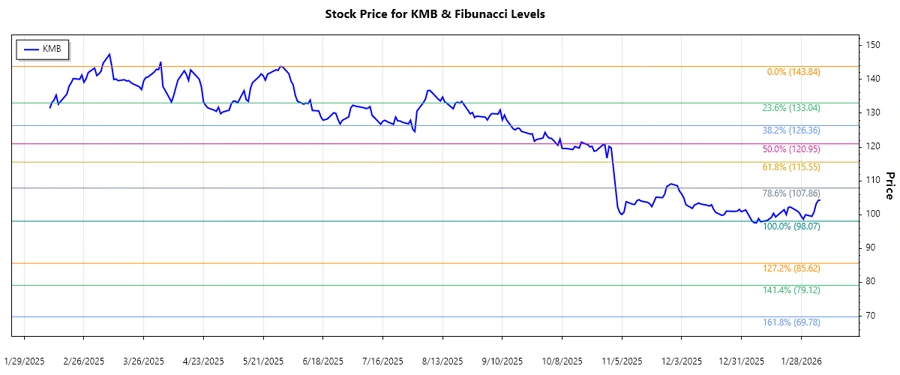
Based on the historical data, the identified trend for Kimberly-Clark Corporation is a downward movement. The analysis covers the period from September 26, 2025, to February 6, 2026. This trend allows us to calculate key Fibonacci retracement levels that are likely to act as support or resistance going forward.
| Period | High | Low | Current Price |
|---|---|---|---|
| September 26, 2025 - February 6, 2026 | $143.84 on May 29, 2025 | $98.07 on January 5, 2026 | $104.33 on February 6, 2026 |
Fibonacci Retracement Levels
| Retracement Level | Price |
|---|---|
| 0.236 | $111.69 |
| 0.382 | $117.64 |
| 0.5 | $120.95 |
| 0.618 | $124.25 |
| 0.786 | $129.06 |
The current price of $104.33 is below the 0.236 retracement level, indicating that the stock is not in a retracement zone and remains in a bearish trend. This suggests potential for further decline unless a reversal is confirmed.
Technically, if the stock price finds support above any of these levels, it could indicate a potential reversal or pause in the downtrend.
Conclusion
The current analysis of Kimberly-Clark's (KMB) stock suggests ongoing pressure with potential downside risk. Observing the behavior around key Fibonacci levels is crucial to understanding potential support or resistance zones. As market conditions evolve, the persistence of the downtrend may present opportunities for strategic long positions if significant support is confirmed. On the contrary, breaking below key levels can signal caution for more downside potential.