April 29, 2026 a 12:46 pm
KMB: Dividend Analysis - Kimberly-Clark Corporation
Kimberly-Clark Corporation is a stalwart in the consumer goods sector, known for its strong dividend history and stable cash flows. With a dividend yield standing at 4.84%, it attracts income-focused investors. The company's resilient performance through varying economic cycles underscores its attractive and dependable dividend profile.
📊 Overview
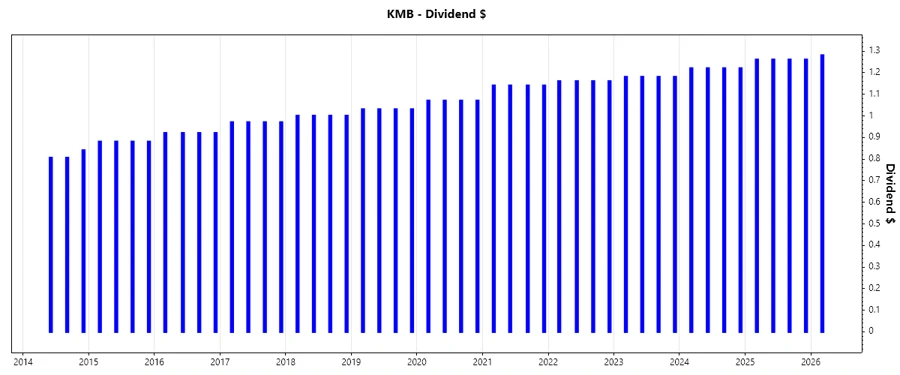
Kimberly-Clark, with its 42 years of uninterrupted dividend history, exemplifies consistency in shareholder returns. Operating in the consumer staples sector, it presents a dividend yield of 4.84% and a current dividend payout of $4.98 per share, with no rescissions or suspensions in recent history.
| Detail | Value |
|---|---|
| Sector | Consumer Goods |
| Dividend Yield | 4.84% |
| Current Dividend Per Share | $4.98 |
| Dividend History | 42 years |
| Last Cut or Suspension | None |
🗣️ Dividend History
The longevity and consistency in Kimberly-Clark's dividend history highlight the company's commitment to returning capital to shareholders. This track record is crucial for investors seeking reliable income streams.
| Year | Dividend Per Share (USD) |
|---|---|
| 2026 | 1.28 |
| 2025 | 5.04 |
| 2024 | 4.88 |
| 2023 | 4.72 |
| 2022 | 4.64 |
📈 Dividend Growth
Tracking growth over time indicates a company's ability to enhance shareholder value. Kimberly-Clark shows a modest but consistent dividend growth at 2.79% (3-year) and 3.32% (5-year).
| Time | Growth |
|---|---|
| 3 years | 2.79% |
| 5 years | 3.32% |
The average dividend growth is 3.32% over 5 years. This shows moderate but steady dividend growth.
⚠️ Payout Ratio
Payout ratios provide insight into a company's ability to maintain dividend payments. Kimberly-Clark's EPS-based payout ratio is 78.06%, with a free cash flow-based ratio at 64.16%, reflecting a cautious but disciplined approach to dividends.
| Key Figure | Ratio |
|---|---|
| EPS-based | 78.06% |
| Free cash flow-based | 64.16% |
A payout ratio of 78.06% suggests adequate earnings coverage, while 64.16% based on free cash flow is strong, indicating sustainable dividend payments.
✅ Cashflow & Capital Efficiency
Assessing cash flow and capital efficiency is vital to understanding a company's operational effectiveness and sustainability of dividend payments.
| Metric | 2023 | 2024 | 2025 |
|---|---|---|---|
| Free Cash Flow Yield | 6.75% | 5.69% | 4.88% |
| Earnings Yield | 4.29% | 5.76% | 6.01% |
| CAPEX to Operating Cash Flow | 21.62% | 22.29% | 40.98% |
| Stock-based Compensation to Revenue | 0.83% | 0.65% | 0.81% |
| FCF / Operating Cash Flow Ratio | 59.02% | 77.70% | 59.02% |
The cash flow metrics indicate robust operational efficiency, supporting dividend sustainability and providing insights into capital allocation effectiveness.
📉 Balance Sheet & Leverage Analysis
Analyzing leverage and balance sheet health offers clues to a company's long-term viability and financial strategy.
| Metric | 2023 | 2024 | 2025 |
|---|---|---|---|
| Debt-to-Equity | 8.87 | 9.42 | 4.77 |
| Debt-to-Assets | 46.78% | 47.84% | 41.61% |
| Debt-to-Capital | 89.87% | 90.41% | 82.68% |
| Net Debt to EBITDA | 2.29 | 1.73 | 2.09 |
| Current Ratio | 0.82 | 0.80 | 0.75 |
| Quick Ratio | 0.54 | 0.54 | 0.54 |
| Financial Leverage | 18.95 | 19.70 | 11.47 |
The high leverage ratios emphasize the importance of ongoing debt management. However, strong interest coverage ratios suggest manageable debt levels.
📊 Fundamental Strength & Profitability
Financial health and profitability metrics highlight operational efficiency and equity value generation capabilities of the company.
| Metric | 2023 | 2024 | 2025 |
|---|---|---|---|
| Return on Equity | 19.28% | 30.30% | 13.46% |
| Return on Assets | 10.17% | 15.38% | 11.73% |
| Net Margin | 8.63% | 12.69% | 11.74% |
| EBIT Margin | 11.33% | 16.00% | 14.47% |
| EBITDA Margin | 15.01% | 19.83% | 18.05% |
| Gross Margin | 34.42% | 35.80% | 35.61% |
| R&D to Revenue | 1.53% | 1.69% | 0% |
The fundamental metrics highlight Kimberly-Clark's robust profitability and indicate potential for future value and dividend growth.
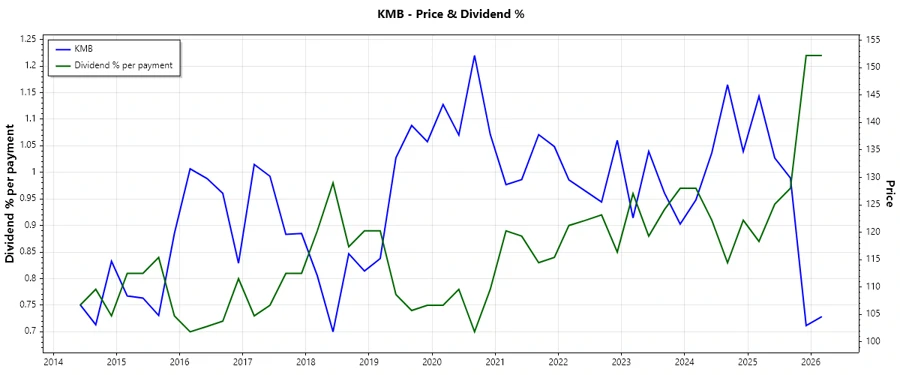
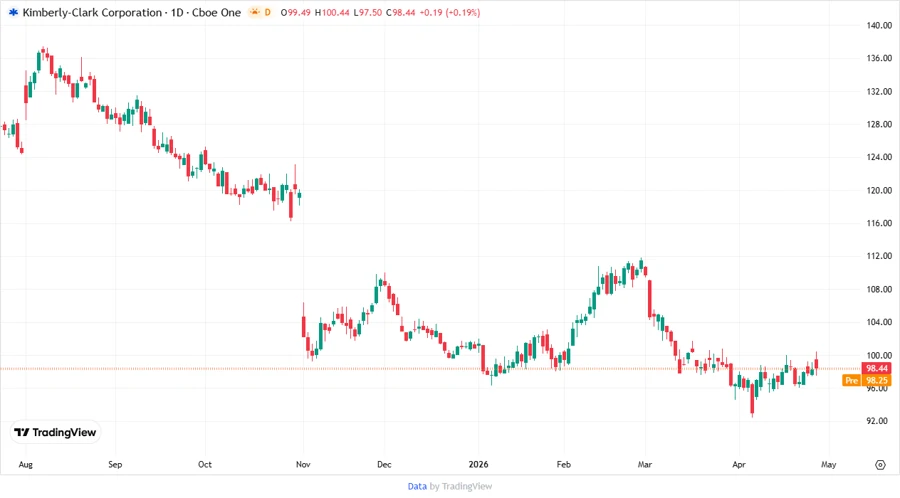
📈 Price Development
🔍 Dividend Scoring System
An in-depth analysis based on critical dividend-related metrics.
| Criteria | Score | Bar |
|---|---|---|
| Dividend Yield | 4 | |
| Dividend Stability | 5 | |
| Dividend Growth | 3 | |
| Payout Ratio | 3 | |
| Financial Stability | 4 | |
| Dividend Continuity | 5 | |
| Cashflow Coverage | 4 | |
| Balance Sheet Quality | 3 |
Total Score: 31/40
🔍 Rating
Kimberly-Clark Corporation demonstrates strong dividend attributes with high stability and continuity scores. Given its long-term growth potential and financial resilience, it is recommended as a solid dividend investment choice for conservative income-focused portfolios.