December 10, 2025 a 03:31 pm
KMB: Dividend Analysis - Kimberly-Clark Corporation
Kimberly-Clark Corporation (KMB) presents a compelling case for dividend investors, backed by consistent payouts over a staggering 41 years. With a current dividend yield of approximately 4.9%, it offers an appealing income stream in today’s volatile market. However, the high payout ratios necessitate close monitoring to ensure sustainability.
📊 Overview
Analyzing Kimberly-Clark's dividend profile reveals its strong standing in the Consumer Goods sector. The current dividend yield is 4.90%, with a dividend per share of USD 4.83. The firm's impressive history of 41 consecutive years of dividend payments underpins its robustness, with the last cut occurring in 2005.
| Detail | Value |
|---|---|
| Sector | Consumer Goods |
| Dividend yield | 4.90% |
| Current dividend per share | 4.83 USD |
| Dividend history | 41 years |
| Last cut or suspension | 2005 |
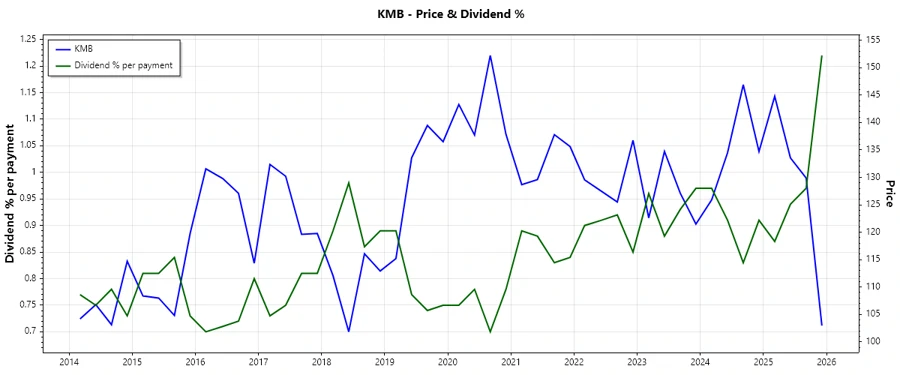
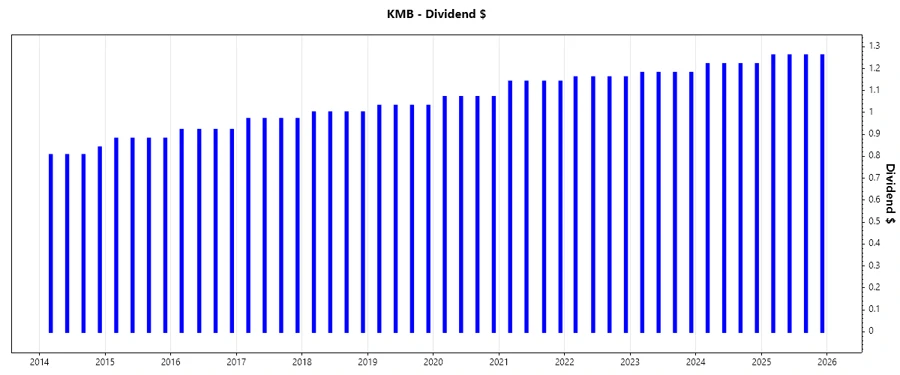
📉 Dividend History
The longevity of KMB's dividend payments indicates a strong commitment to returning value to shareholders. Understanding this history is crucial as it signifies the company’s resilience and management's dedication to maintaining payouts.
| Year | Dividend per Share (USD) |
|---|---|
| 2025 | 5.04 |
| 2024 | 4.88 |
| 2023 | 4.72 |
| 2022 | 4.64 |
| 2021 | 4.56 |
📈 Dividend Growth
Assessing growth provides insights into future payout potential and financial health. KMB has shown a three-year growth rate of 2.29% and a five-year rate of 3.44%, reflecting steady increases, albeit at a moderate pace.
| Time | Growth |
|---|---|
| 3 years | 2.29% |
| 5 years | 3.44% |
The average dividend growth is 3.44% over 5 years. This shows moderate but steady dividend growth.
🗣️ Payout Ratio
Examining payout ratios is key to understanding the sustainability of dividends. KMB’s payout ratio based on EPS stands at 81.41%, while the FCF-based ratio is 66.44%. Lower ratios suggest better room for safety and growth.
| Key figure | Ratio |
|---|---|
| EPS-based | 81.41% |
| Free cash flow-based | 66.44% |
With an EPS payout at 81.41% and FCF payout at 66.44%, these figures are relatively high, indicating that a substantial portion of earnings and cash flow is channeled towards dividend payments, leaving limited margin for adverse changes.
✅ Cashflow & Capital Efficiency
Robust cash flow management is essential for sustaining dividends. KMB’s free cash flow yield and earnings yield provide a solid base, backed by a prudent CAPEX strategy. Examining metrics like Stock-based Compensation to Revenue highlights operational efficiency.
| Key Metric | 2024 | 2023 | 2022 |
|---|---|---|---|
| Free Cash Flow Yield | 5.69% | 6.75% | 4.05% |
| Earnings Yield | 5.76% | 4.29% | 4.22% |
| CAPEX to Operating Cash Flow | 22.29% | 21.63% | 32.05% |
| Stock-based Compensation to Revenue | 0.65% | 0.83% | 0.74% |
| Free Cash Flow / Operating Cash Flow Ratio | 77.71% | 78.37% | 67.95% |
The Cash Flow metrics highlight a stable cash generation capacity, which is reassuring for dividend reliability. Return on Invested Capital also suggests effective capital use.
📊 Balance Sheet & Leverage Analysis
Balance sheet analysis is critical for assessing financial health. The debt ratios of KMB indicate substantial leverage, although supported by sufficient cover ratios like interest coverage.
| Key Metric | 2024 | 2023 | 2022 |
|---|---|---|---|
| Debt-to-Equity | 9.42 | 8.87 | 15.63 |
| Debt-to-Assets | 47.84% | 46.78% | 47.57% |
| Debt-to-Capital | 90.41% | 89.87% | 93.99% |
| Net Debt to EBITDA | 1.73 | 2.29 | 2.41 |
| Current Ratio | 0.80 | 0.82 | 0.78 |
| Quick Ratio | 0.54 | 0.54 | 0.47 |
| Financial Leverage | 19.70 | 18.96 | 32.85 |
While the high leverage indicates potential risks, the company's ability to cover its interest payments is robust, suggesting controlled risk management in its financing structure.
📊 Fundamental Strength & Profitability
Analyzing fundamental strength sheds light on the company's profitability and operational efficiency. Margins and returns are indicative of competitive positioning.
| Key Metric | 2024 | 2023 | 2022 |
|---|---|---|---|
| Return on Equity (ROE) | 3.03% | 1.93% | 3.54% |
| Return on Assets (ROA) | 15.38% | 10.17% | 10.76% |
| Net Margin | 12.69% | 8.63% | 9.59% |
| EBIT Margin | 15.94% | 11.33% | 12.99% |
| EBITDA Margin | 19.83% | 15.01% | 16.73% |
| Gross Margin | 35.80% | 34.42% | 30.83% |
| R&D to Revenue | 1.69% | 1.53% | 1.45% |
Kimberly-Clark exhibits strong fundamental metrics with robust profitability margins, suggesting sustainable long-term operational efficiency despite competitive industry pressures.
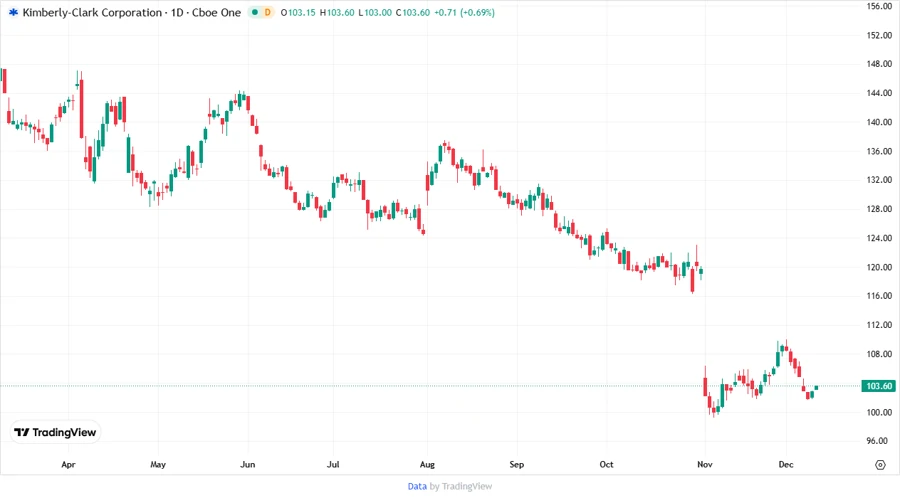
📈 Price Development
⭕ Dividend Scoring System
| Criteria | Score | Score Bar |
|---|---|---|
| Dividend Yield | 4 | |
| Dividend Stability | 5 | |
| Dividend Growth | 3 | |
| Payout Ratio | 3 | |
| Financial Stability | 3 | |
| Dividend Continuity | 5 | |
| Cashflow Coverage | 4 | |
| Balance Sheet Quality | 3 |
Total Score: 30/40
⭐ Rating
Overall, Kimberly-Clark Corporation displays a solid dividend profile, characterized by a dependable payout history and stable growth prospects. However, given the high payout ratios and leverage, this stock is better suited for income-oriented investors who can tolerate moderate financial risks. It is recommended to consider holding KMB as a steady income-generating asset while monitoring debt and cash flow carefully.