August 08, 2025 a 07:46 am


KMB: Dividend Analysis - Kimberly-Clark Corporation
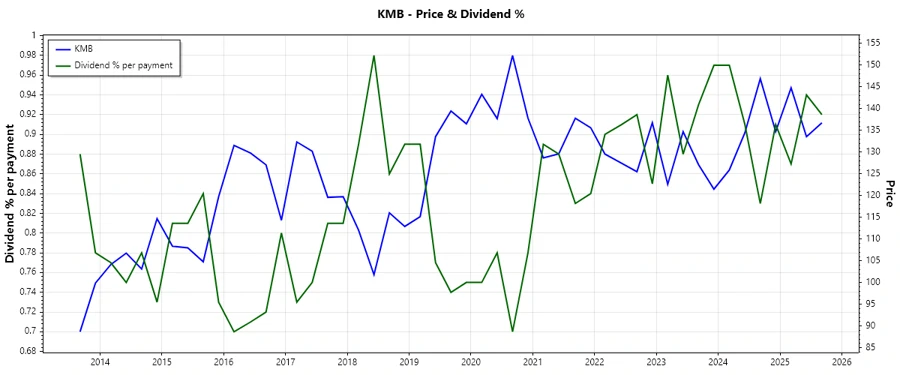
Kimberly-Clark Corporation is recognized for its stable dividend payouts, consistent growth, and strong market presence. The company's impressive dividend history, paired with its strategic market positioning, renders it an appealing choice for dividend-focused investors. Furthermore, the financial stability and historical performance highlight Kimberly-Clark's resilience and commitment to shareholders, despite market fluctuations. However, as with any investment, it's crucial to monitor ongoing financial metrics and market dynamics.
📊 Overview
In the consumer products sector, Kimberly-Clark Corporation exhibits a robust dividend yield of 3.66%. With a current dividend per share of USD 4.83, the company boasts an impressive 41-year history of uninterrupted dividends. The absence of any recent dividend cut or suspension underscores the firm's commitment to its shareholders.
| Attribute | Value |
|---|---|
| Sector | Consumer Products |
| Dividend Yield | 3.66% |
| Current Dividend Per Share | $4.83 |
| Dividend History | 41 years |
| Last Cut or Suspension | None |
🗣️ Dividend History
The company's long dividend history is an indicator of its earnings stability and consistent capital allocation strategy. Assessing dividend history assists in predicting future payouts and understanding the company's dedication to returning capital to shareholders.
| Year | Dividend Per Share (USD) |
|---|---|
| 2025 | $3.78 |
| 2024 | $4.88 |
| 2023 | $4.72 |
| 2022 | $4.64 |
| 2021 | $4.56 |
📈 Dividend Growth
Assessing dividend growth is crucial for investors seeking income and capital appreciation. Sustained dividend growth reflects management's confidence in future earnings potential.
| Time | Growth |
|---|---|
| 3 years | 2.29% |
| 5 years | 3.44% |
The average dividend growth is 3.44% over 5 years, indicating moderate but steady increases, enhancing shareholder value over time.
✅ Payout Ratio
The payout ratio is a critical metric for assessing dividend sustainability. A balance between EPS and FCF payout ratios ensures dividends are supported by both earnings and cash flow.
| Key Figure | Ratio |
|---|---|
| EPS-based | 66.34% |
| Free Cash Flow-based | 76.25% |
The EPS payout ratio of 66.34% and FCF payout ratio of 76.25% suggest dividends are sustainable, with sufficient profitability and cash flow coverage.
💰 Cashflow & Capital Efficiency
Strong cashflow metrics are essential for dividend security and capital efficiency. Analyzing these figures aids investors in identifying potential financial stress or inefficiencies.
| Metric | 2024 | 2023 | 2022 |
|---|---|---|---|
| Free Cash Flow Yield | 5.69% | 6.75% | 4.05% |
| Earnings Yield | 5.76% | 4.29% | 4.22% |
| CAPEX to Operating Cash Flow | 22.29% | 21.63% | 32.05% |
| Stock-based Compensation to Revenue | 0.65% | 0.83% | 0.74% |
| Free Cash Flow / Operating Cash Flow Ratio | 77.71% | 78.37% | 67.95% |
The data reflects strong cashflow stability and efficient capital management, providing assurance for ongoing dividend distributions.
⚖️ Balance Sheet & Leverage Analysis
A stable balance sheet is pivotal in maintaining creditworthiness and financing dividends. Leverage ratios inform about debt levels and financial risk.
| Metric | 2024 | 2023 | 2022 |
|---|---|---|---|
| Debt-to-Equity | 9.42 | 8.87 | 15.40 |
| Debt-to-Assets | 47.84% | 46.78% | 46.87% |
| Debt-to-Capital | 90.41% | 89.87% | 93.90% |
| Net Debt to EBITDA | 1.73 | 2.29 | 2.37 |
| Current Ratio | 0.80 | 0.82 | 0.78 |
| Quick Ratio | 0.54 | 0.54 | 0.47 |
| Financial Leverage | 19.70 | 18.96 | 32.85 |
While debt levels are significant, the coverage ratios and cash flows suggest Kimberly-Clark can manage its obligations, maintaining its financial stability.
💡 Fundamental Strength & Profitability
Profitability metrics highlight operational efficiency and capability to generate returns for shareholders.
| Metric | 2024 | 2023 | 2022 |
|---|---|---|---|
| Return on Equity | 3.03% | 1.93% | 3.54% |
| Return on Assets | 0.15% | 0.10% | 0.11% |
| Net Margin | 12.69% | 8.63% | 9.59% |
| Gross Margin | 35.80% | 34.42% | 30.83% |
| EBIT Margin | 15.94% | 11.33% | 12.99% |
| EBITDA Margin | 19.83% | 15.01% | 16.73% |
| Research & Development to Revenue | 1.79% | 1.53% | 1.45% |
The profitability indicators show consistent margins and returns, reflecting strong financial health despite an environment of rising costs.
🎯 Dividend Scoring System
| Category | Score | Visualization |
|---|---|---|
| Dividend Yield | 4 | |
| Dividend Stability | 5 | |
| Dividend Growth | 3 | |
| Payout Ratio | 4 | |
| Financial Stability | 3 | |
| Dividend Continuity | 5 | |
| Cashflow Coverage | 4 | |
| Balance Sheet Quality | 3 |
Overall Score: 31/40
📉 Rating
Kimberly-Clark Corporation presents a robust investment profile with a strong dividend track record, making it a favorable option for income-oriented investors. The company’s commitment to maintaining and growing dividends, alongside its steady cash flow and solid financial framework, ensures continued shareholder returns. However, investors should remain vigilant about leverage levels and broader market conditions. Overall, Kimberly-Clark appears well-positioned for sustained performance and dividend reliability.