May 28, 2025 a 03:31 pm


KMB: Dividend Analysis - Kimberly-Clark Corporation
Kimberly-Clark Corporation (KMB) presents a resilient dividend profile with an impressive track record of 41 years of consecutive dividend payouts. With a decent dividend yield and moderate growth, this stock is a potential income-generator for dividend-focused investors.
📊 Overview
Kimberly-Clark Corporation operates within the consumer staples sector. With a current dividend yield of 3.47% and a dividend per share of $4.83, investors can expect consistent returns. The company's dividend history spans 41 years, showcasing its commitment to returning capital to shareholders. Notably, there have been no recent dividend cuts or suspensions.
| Metric | Details |
|---|---|
| Sector | Consumer Staples |
| Dividend yield | 3.47% |
| Current dividend per share | $4.83 |
| Dividend history | 41 years |
| Last cut or suspension | None |
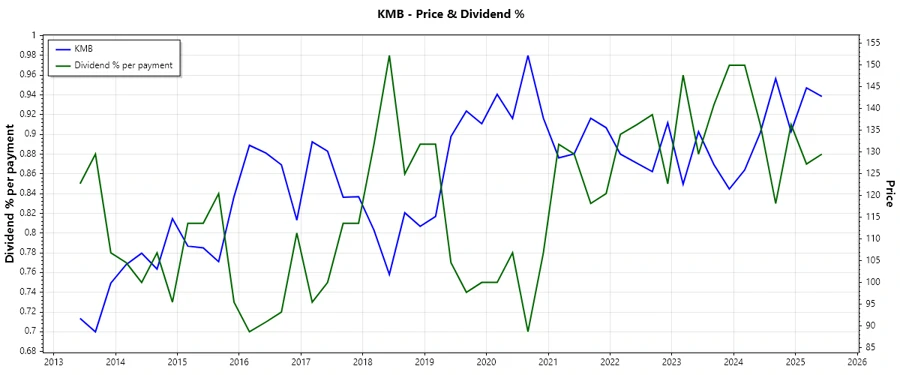
🗣️ Dividend History
The robust dividend history of Kimberly-Clark is a testament to its financial stability and dedication to returning value to shareholders. Awareness of historical payouts can inform projections of future dividend reliability.
| Year | Dividend per Share (USD) |
|---|---|
| 2025 | 2.52 |
| 2024 | 4.88 |
| 2023 | 4.72 |
| 2022 | 4.64 |
| 2021 | 4.56 |
📈 Dividend Growth
The growth of dividends provides insights into a company's future payout capacity. Over the past three and five years, Kimberly-Clark has exhibited steady dividend growth, although at moderate rates.
| Time | Growth |
|---|---|
| 3 years | 2.29% |
| 5 years | 3.44% |
The average dividend growth is 3.44% over 5 years. This shows moderate but steady dividend growth.
📉 Payout Ratio
Payout ratios highlight the sustainability of a company's dividend. With an EPS-based payout of 65.01% and an FCF-based payout of 61.73%, Kimberly-Clark maintains a conservative dividend policy that supports its ability to sustain or increase dividends.
| Key figure | Ratio |
|---|---|
| EPS-based | 65.01% |
| Free cash flow-based | 61.73% |
With an EPS payout ratio below 70%, Kimberly-Clark is well-positioned to continue paying, or even raise, its dividends, provided cash flows remain stable.
✅ Cashflow & Capital Efficiency
Cash flow metrics and capital efficiency are crucial for evaluating a company's financial health and its ability to afford dividends. Kimberly-Clark's free cash flow and earnings yield indicate robust cash generation, fundamental to dividend payouts.
| Metric | 2024 | 2023 | 2022 |
|---|---|---|---|
| Free Cash Flow Yield | 5.69% | 6.75% | 4.05% |
| Earnings Yield | 5.76% | 4.29% | 4.22% |
| CAPEX to Operating Cash Flow | 22.29% | 21.63% | 32.05% |
| Stock-based Compensation to Revenue | 0.65% | 0.83% | 0.74% |
| Free Cash Flow / Operating Cash Flow | 77.71% | 78.37% | 67.95% |
The company's ability to maintain strong free cash flow relative to operating cash flow solidifies the reliability of its dividend payments.
🗣️ Balance Sheet & Leverage Analysis
Analyzing debt metrics helps assess financial stability and risks associated with leverage. Kimberly-Clark's stability is reflected in its formidable coverage ratios, suggesting efficient debt handling.
| Metric | 2024 | 2023 | 2022 |
|---|---|---|---|
| Debt-to-Equity | 9.02 | 8.87 | 15.40 |
| Debt-to-Assets | 45.78% | 46.78% | 46.87% |
| Debt-to-Capital | 90.02% | 89.87% | 93.90% |
| Net Debt to EBITDA | 1.65 | 2.29 | 2.37 |
| Current Ratio | 0.80 | 0.82 | 0.78 |
| Quick Ratio | 0.54 | 0.54 | 0.47 |
| Financial Leverage | 19.70 | 18.96 | 32.85 |
Despite high debt-to-equity ratios, Kimberly-Clark effectively manages its leverage with a healthy interest coverage ratio, underpinning its liquidity strength.
📈 Fundamental Strength & Profitability
Profitability metrics are vital for understanding company strength. Kimberly-Clark's stable return on equity and solid EBIT margin demonstrate profitability efficiency that supports sustainable dividends.
| Metric | 2024 | 2023 | 2022 |
|---|---|---|---|
| Return on Equity | 3.03% | 1.93% | 3.54% |
| Return on Assets | 0.15% | 0.10% | 0.11% |
| Net Margin | 12.69% | 8.63% | 9.59% |
| EBIT Margin | 15.94% | 11.33% | 12.99% |
| EBITDA Margin | 19.83% | 15.01% | 16.73% |
| Gross Margin | 35.80% | 34.42% | 30.83% |
| R&D to Revenue | 0% | 1.53% | 1.45% |
The profitability performance of Kimberly-Clark suggests efficient use of capital, underpinning its robust dividend policy. The company's gross margin further enhances its ability to maintain steady operations and shareholder distributions.
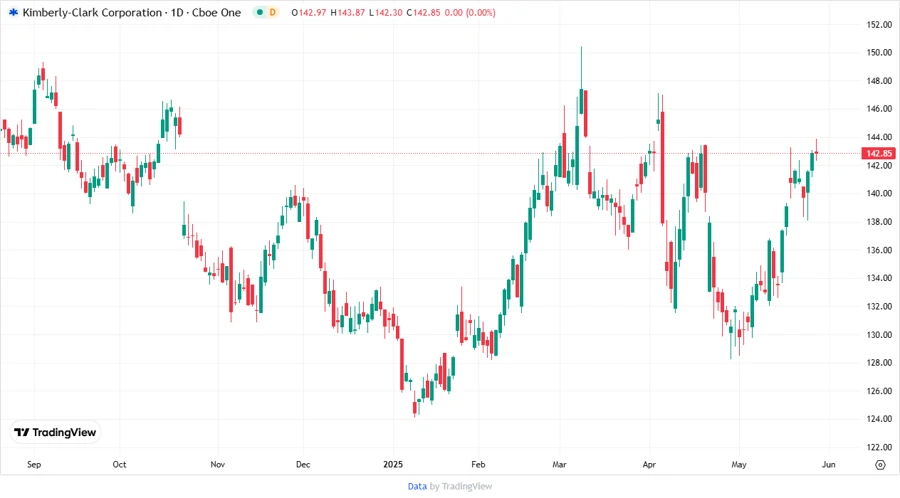
Price Development 📉
🔍 Dividend Scoring System
Evaluate each category to arrive at an overall score out of 40 points.
| Criteria | Score | Score Bar |
|---|---|---|
| Dividend yield | 4 | |
| Dividend Stability | 5 | |
| Dividend growth | 3 | |
| Payout ratio | 4 | |
| Financial stability | 4 | |
| Dividend continuity | 5 | |
| Cashflow Coverage | 4 | |
| Balance Sheet Quality | 3 |
Total Score: 32/40
Rating ✅
Kimberly-Clark Corporation stands as a reliable option for dividend investors, offering both stability and moderate growth prospects. Its long history of dividend payments, bolstered by sound financial metrics, makes it a prudent choice for income-focused portfolios.
Smart Data Insight
Master the Perfect Entry & Exit for this Stock
Don't leave your profits to chance. Historically, this stock follows specific seasonal patterns that institutional traders use to maximize returns.
- ✅ Identify the "Golden Buying Window"
- ✅ Avoid high-risk correction cycles
- ✅ Backtested data from the last 20+ years