November 01, 2025 a 03:15 am
KLAC: Trend and Support & Resistance Analysis - KLA Corporation
KLA Corporation shows strong potential in the semiconductor sector, thanks to its innovative process control solutions. Despite recent fluctuations, the stock exhibits a notable upward trajectory, reflecting investor confidence. However, given the sector's inherent volatility, careful monitoring of support and resistance levels is essential for potential investors.
Trend Analysis
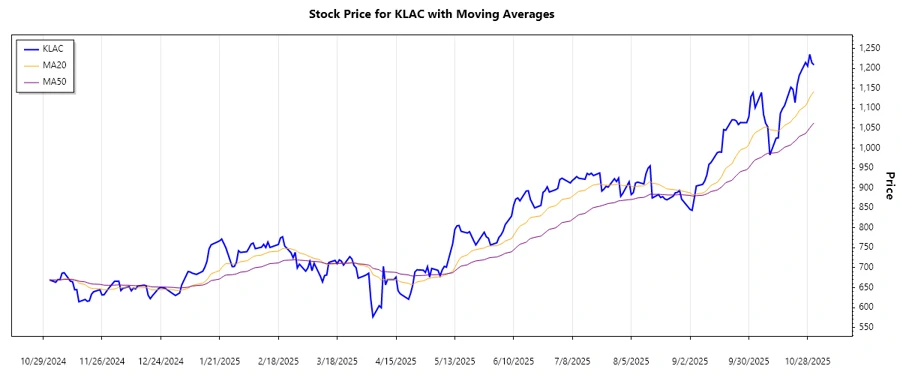
The analysis of KLAC stock data reveals a remarkable ascending trend over recent months. The calculation of the Exponential Moving Average (EMA) for 20 and 50 days supports these observations. The recent market behavior demonstrates a clear upward trajectory, highlighted by EMA values.
| Date | Closing Price | Trend |
|---|---|---|
| 2025-10-31 | 1208.74 | ▲ |
| 2025-10-30 | 1214.41 | ▲ |
| 2025-10-29 | 1235.28 | ▲ |
| 2025-10-28 | 1206.04 | ▲ |
| 2025-10-27 | 1215.13 | ▲ |
| 2025-10-24 | 1182.82 | ▲ |
| 2025-10-23 | 1159.00 | ▲ |
The EMA20 of 1166.78 and EMA50 of 1034.45 (▲) indicate a consistent upward trend. This technical signal is favorable for bullish market participants.
Support- and Resistance
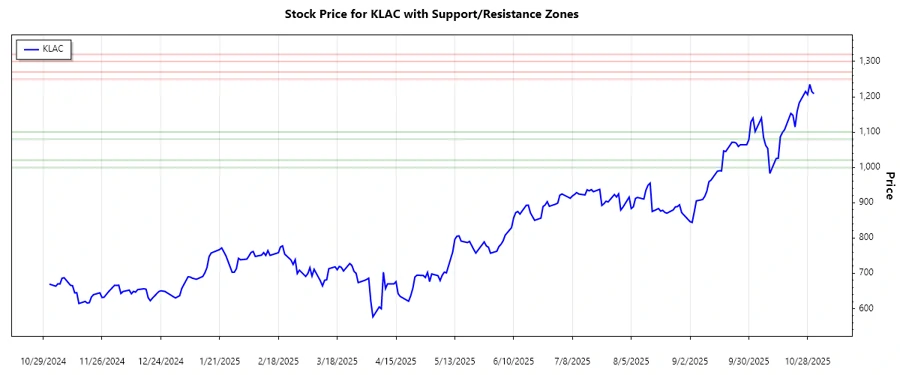
Upon analyzing the data, two key support and resistance zones were identified. These zones are essential for traders aiming to predict future buy-and-sell levels.
| Zone Type | Start | End |
|---|---|---|
| Support ▲ | 1080.00 | 1100.00 |
| Support ▲ | 1000.00 | 1020.00 |
| Resistance ▼ | 1250.00 | 1270.00 |
| Resistance ▼ | 1300.00 | 1320.00 |
The current price level hovers near the upper resistance zone, suggesting possible consolidation or pullback in the short term.
Conclusion
In summary, KLA Corporation's stock demonstrates continuous growth in the semiconductor industry, showcasing an upward trend with a strong technical foundation. Traders should stay vigilant for potential consolidation near resistance zones, presenting both opportunities and challenges. Given the sector's demand, KLAC remains a promising investment; however, sector volatility poses inherent risks. Investors should weigh these factors when making decisions, factoring in market trends and key levels.
Smart Data Insight
Master the Perfect Entry & Exit for this Stock
Don't leave your profits to chance. Historically, this stock follows specific seasonal patterns that institutional traders use to maximize returns.
- ✅ Identify the "Golden Buying Window"
- ✅ Avoid high-risk correction cycles
- ✅ Backtested data from the last 20+ years