August 20, 2025 a 08:15 am
KLAC: Trend and Support & Resistance Analysis - KLA Corporation
The recent trend for KLA Corporation (KLAC) shows an interesting movement, exemplifying both resilience and potential for growth in the semiconductor sector. The stock has exhibited significant volatility, likely reflecting broader market conditions and sector-specific dynamics. Investors should be mindful of potential support and resistance zones as these could indicate crucial points of decision-making for market participants.
Trend Analysis
| Date | Close Price | Trend |
|---|---|---|
| 2025-08-19 | 876.08 | ▼ |
| 2025-08-18 | 883.39 | ▼ |
| 2025-08-15 | 874.94 | ▲ |
| 2025-08-14 | 955.41 | ▲ |
| 2025-08-13 | 949.48 | ▲ |
| 2025-08-12 | 935.53 | ▼ |
| 2025-08-11 | 910.18 | ▼ |
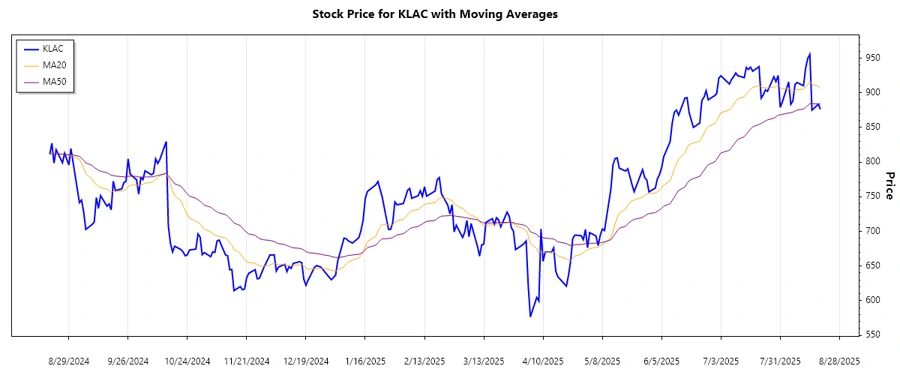
The calculation of moving averages shows recent fluctuations with the EMA20 crossing below EMA50, indicating an emerging bearish trend in the shorter term. This suggests investors should be cautious of further downswings.
Support- and Resistance
| Zone | From | To |
|---|---|---|
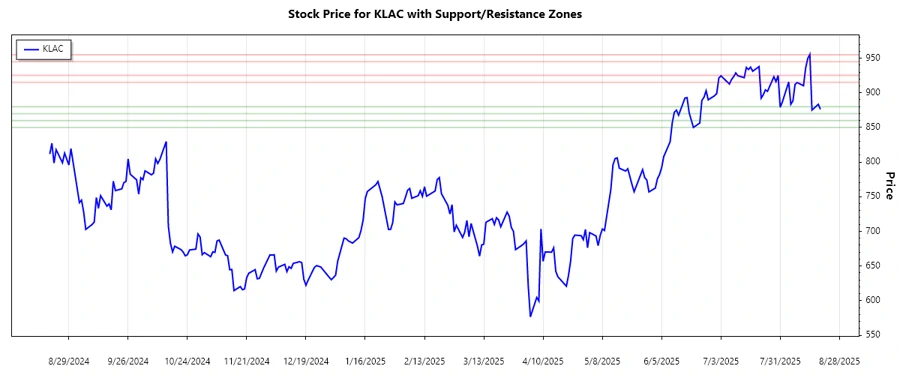
| Support 1 | 870.00 | 880.00 |
| Support 2 | 850.00 | 860.00 |
| Resistance 1 | 915.00 | 925.00 |
| Resistance 2 | 945.00 | 955.00 |
Currently, the price is located in the middle, within neither a significant support nor resistance zone. Technical indicators suggest the price could move towards the lower support levels if further downward pressure persists.
Conclusion
The stock of KLA Corporation is experiencing a complex phase with potential downward adjustments indicated by moving averages. This suggests investors should closely monitor upcoming market changes. A significant break above stated resistance levels could invalidate this downtrend, making it an area to watch for potential bullish reversals. Risks include macroeconomic factors affecting the semiconductor industry's overall performance. However, considering the broad applications of KLA's technology, there remains substantial growth potential.
Smart Data Insight
Master the Perfect Entry & Exit for this Stock
Don't leave your profits to chance. Historically, this stock follows specific seasonal patterns that institutional traders use to maximize returns.
- ✅ Identify the "Golden Buying Window"
- ✅ Avoid high-risk correction cycles
- ✅ Backtested data from the last 20+ years