November 17, 2025 a 10:15 am

KLAC: Fibonacci Analysis - KLA Corporation
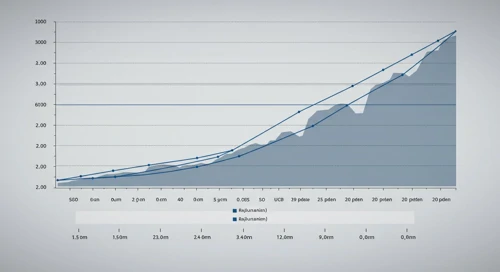
KLA Corporation has shown a significant upward trend in recent months driven by robust demand in the semiconductor industry. The company’s technological advancements in process control are leading to improved manufacturing efficiencies, which is reflected in their ascending stock price. Technical analysis suggests that the stock has moved into a promising zone, although caution is advised due to potential market volatilities that could introduce corrections.
Fibonacci Analysis
| Trend Period | High Date | High Price | Low Date | Low Price |
|---|---|---|---|---|
| 2025-04-08 to 2025-11-10 | 2025-11-10 | 1217.95 | 2025-04-08 | 599.51 |
| Fibonacci Level | Price |
|---|---|
| 0.236 | 821.77 |
| 0.382 | 930.78 |
| 0.5 | 908.73 |
| 0.618 | 986.68 |
| 0.786 | 1100.43 |
The current price appears to be within the 0.618 retracement level, suggesting potential support in this region. This might offer a buying opportunity if the stock holds at this level, although breaking below could signal a further bearish retracement.
Conclusion
The KLA Corporation stock has demonstrated a robust upward trend, largely attributed to positive industry dynamics and the company's strategic positioning. Short-term challenges may arise if the stock dips below crucial retracement levels; however, the longer-term outlook remains optimistic due to the firm's growth potential. Investors should monitor support levels closely while capitalizing on appreciated valuation. The Fibonacci analysis indicates potential strong support areas that, if respected, could maintain the upward momentum observed over the past months.