July 30, 2025 a 06:44 am

KLAC: Fibonacci Analysis - KLA Corporation
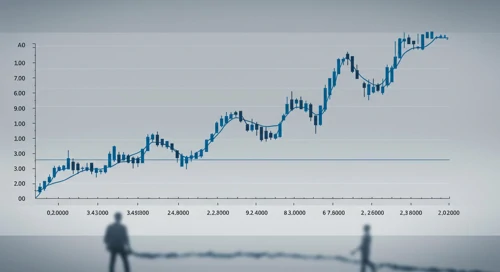
The KLA Corporation exhibits resilience in the semiconductor sector with strong demand for their inspection and process control solutions. The stock has recently shown a significant upward trend after a bottom was identified in early April 2025. Notably, it reached a new high in late July 2025, indicating robust investor sentiment despite volatile market conditions. This upward trend provides an ideal backdrop for applying Fibonacci retracement levels to identify potential support and resistance zones.
Fibonacci Analysis
| Details | Information |
|---|---|
| Trend Date Range | 2025-04-03 to 2025-07-29 |
| High Point (Price & Date) | $937.76 on 2025-07-21 |
| Low Point (Price & Date) | $620.82 on 2025-04-03 |
| Fibonacci Levels |
|
| Current Price Retracement | The current price of $916.09 indicates it is above the highest Fibonacci retracement zone and suggests a continuation of the bullish trend. |
| Technical Interpretation | The stock is showing strength beyond traditional retracement zones, indicating potential continuation. Use immediate Fibonacci zones as support until proven otherwise. |
Conclusion
The KLA Corporation stock has shown significant resilience and strength, as evident from recent price movements reaching above prior Fibonacci levels. This suggests a strong bullish sentiment with potential further upside if momentum is sustained. However, investors should remain cautious of potential retracements at traditional support levels provided by Fibonacci analysis. For analysts, keeping an eye on external influences in the semiconductor industry, such as supply chain fluctuations or technological advances, could be crucial for better forecasting the stock's trajectory. The current upper price range may act as a new support, given ongoing positive market conditions.
Smart Data Insight
Master the Perfect Entry & Exit for this Stock
Don't leave your profits to chance. Historically, this stock follows specific seasonal patterns that institutional traders use to maximize returns.
- ✅ Identify the "Golden Buying Window"
- ✅ Avoid high-risk correction cycles
- ✅ Backtested data from the last 20+ years