July 14, 2025 a 06:44 am

KLAC: Fibonacci Analysis - KLA Corporation
KLA Corporation has shown robust advancements in the semiconductor industry, continuously innovating within critical process control, process-enabling, and yield management solutions. The recent price trend in their stock showcases a strong market position, supported by their diversified product offerings in semiconductor process control and component inspection solutions. Investors are closely analyzing KLAC as it navigates through a dynamic market landscape.
Fibonacci Analysis
| Metric | Value |
|---|---|
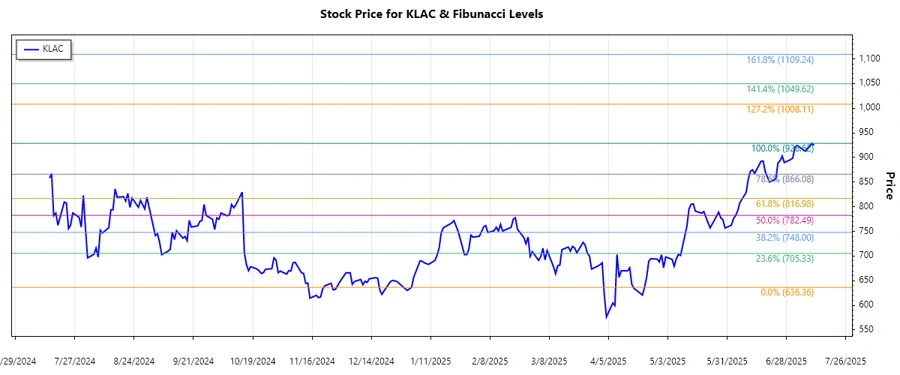
| Start Date | 2024-07-16 |
| End Date | 2025-07-11 |
| High Point | $928.62 (2025-07-10) |
| Low Point | $636.36 (2025-04-22) |
| Fibonacci 0.236 | $712.54 |
| Fibonacci 0.382 | $754.39 |
| Fibonacci 0.500 | $782.49 |
| Fibonacci 0.618 | $810.60 |
| Fibonacci 0.786 | $851.89 |
| Current Price | $924.58 |
| Retracement Zone | None |
| Interpretation | The current price is above all significant Fibonacci retracement levels, suggesting potential resistance breaking and bullish momentum continuation. |
Conclusion
KLA Corporation has demonstrated strong positive momentum in the market, reflecting a pronounced uptrend over the recent months. With the current price exceeding critical Fibonacci levels, there is a significant indication of sustained bullish momentum and potential upward resistance breaks. While the ongoing semiconductor market dynamics present growth opportunities, volatility remains a key concern for investors. However, KLAC's well-anchored market presence and diverse product portfolio provide a strategic cushion against potential industry headwinds. Technical analysts may view this as a robust positioning for continuous growth, keeping an eye on key resistance levels for future trading strategies.
Smart Data Insight
Master the Perfect Entry & Exit for this Stock
Don't leave your profits to chance. Historically, this stock follows specific seasonal patterns that institutional traders use to maximize returns.
- ✅ Identify the "Golden Buying Window"
- ✅ Avoid high-risk correction cycles
- ✅ Backtested data from the last 20+ years