May 02, 2026 a 03:31 am
KLAC: Dividend Analysis - KLA Corporation
KLA Corporation exhibits a consistent dividend history, making it a solid choice for dividend investors seeking stability. With a market presence spanning over two decades of dividend distributions, KLAC has shown resilience in its operations and fiscal policies. Though its dividend yield might appear modest, the company's reliability and dividend growth over recent years exemplify a strong shareholder return strategy.
📊 Overview
KLA Corporation, operating primarily in the semiconductor industry, has maintained a steady dividend policy for 22 years. The current dividend yield stands at 0.52% with a robust dividend per share of 6.80 USD. Notably, KLAC has consistently increased its dividends with no historical cuts, reinforcing confidence among investors.
| Attribute | Value |
|---|---|
| Sector | Semiconductors |
| Dividend yield | 0.52% |
| Current dividend per share | 6.80 USD |
| Dividend history | 22 years |
| Last cut or suspension | None |
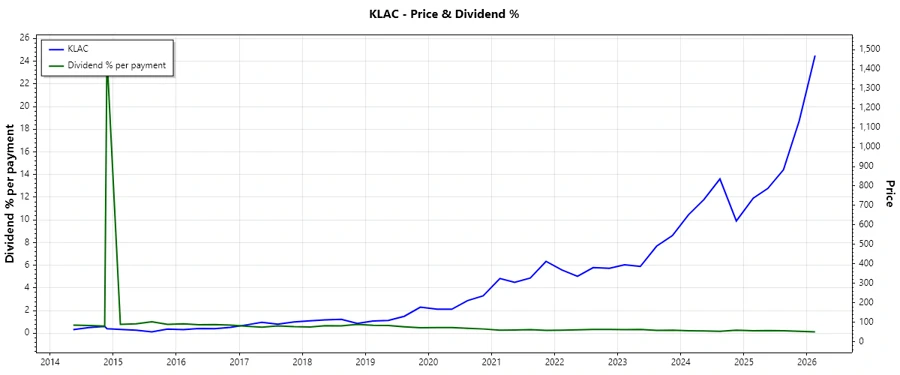
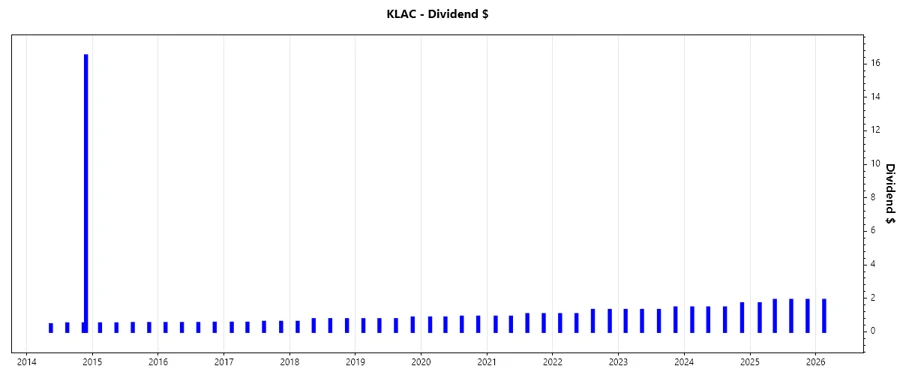
🗣️ Dividend History
Evaluating the dividend history is crucial as it reflects the company's commitment to returning value to shareholders. KLAC's increasing dividend payments over the years demonstrate its mature and stable financial standing.
| Year | Dividend Per Share (USD) |
|---|---|
| 2026 | 1.90 |
| 2025 | 7.40 |
| 2024 | 6.05 |
| 2023 | 5.35 |
| 2022 | 4.70 |
📈 Dividend Growth
Dividend growth is a critical indicator of a company's ability to enhance shareholder value over time. It suggests potential future financial performance improvements and stability.
| Time | Growth |
|---|---|
| 3 years | 16.34% |
| 5 years | 16.15% |
The average dividend growth is 16.15% over 5 years. This shows moderate but steady dividend growth, pointing to a potential for continued income increases.
📉 Payout Ratio
The payout ratio signals a company's dividend sustainability. KLAC’s EPS-based and free cash flow-based ratios suggest a well-balanced approach, ensuring sustainable dividend payouts.
| Key figure | Ratio |
|---|---|
| EPS-based | 19.06% |
| Free cash flow-based | 22.26% |
A payout ratio of 19.06% (EPS) and 22.26% (FCF) indicates that KLAC maintains prudent levels of cash retention for growth and operational exigencies.
✅ Cashflow & Capital Efficiency
An analysis of cash flows and capital efficiency highlights the company’s financial robustness. It evaluates its capability to finance operations and dividends via operational cash.
| Metric | 2025 | 2024 | 2023 |
|---|---|---|---|
| Free Cash Flow Yield | 3.14% | 2.71% | 4.92% |
| Earnings Yield | 3.41% | 2.47% | 5.01% |
| CAPEX to Operating Cash Flow | 8.79% | 8.38% | 9.31% |
| Stock-based Compensation to Revenue | 2.19% | 2.17% | 1.63% |
| Free Cash Flow / Operating Cash Flow Ratio | 91.67% | 91.62% | 90.69% |
The positive cash flow yields and operating cash flow ratios indicate that KLAC efficiently generates sufficient cash to cover dividends and invest in growth opportunities.
⚠️ Balance Sheet & Leverage Analysis
Assessing leverage ratios provides insight into the company’s level of risk in terms of debt. Debt levels relative to equity and assets indicate its financial stability and liquidity.
| Ratio | 2025 | 2024 | 2023 |
|---|---|---|---|
| Debt-to-Equity | 1.30 | 2.02 | 2.08 |
| Debt-to-Assets | 37.89% | 44.19% | 43.09% |
| Debt-to-Capital | 56.47% | 66.94% | 67.50% |
| Net Debt to EBITDA | 0.75 | 1.24 | 0.92 |
| Current Ratio | 2.62 | 2.15 | 2.24 |
| Quick Ratio | 1.83 | 1.50 | 1.47 |
| Financial Leverage | 3.42 | 4.58 | 4.82 |
While the financial leverage indicates high debt usage, the debt metrics against assets and equity demonstrate manageable risk levels, underpinning KLAC's strategic debt management.
📊 Fundamental Strength & Profitability
The profitability margins and R&D investments highlight the entity’s operational efficiency, thereby contributing to long-term shareholder gains and corporate growth.
| Metric | 2025 | 2024 | 2023 |
|---|---|---|---|
| Return on Equity | 86.56% | 81.99% | 116.01% |
| Return on Assets | 25.28% | 17.90% | 24.07% |
| Net Margin | 33.41% | 28.15% | 32.27% |
| EBIT Margin | 40.69% | 35.68% | 38.93% |
| EBITDA Margin | 43.93% | 39.78% | 42.89% |
| Gross Margin | 62.32% | 59.97% | 59.81% |
| R&D to Revenue | 11.15% | 13.03% | 12.35% |
KLAC’s impressive profitability, aligned with substantial R&D investments, underscores its strong market position and innovation-driven growth prospects.
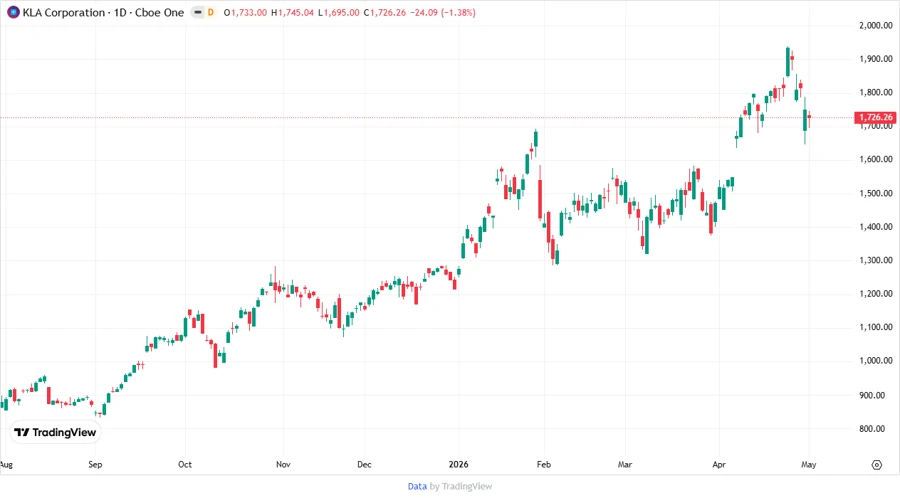
🔄 Price Development
✅ Dividend Scoring System
Evaluating KLAC’s dividend facets provides insight into its performance across various criteria crucial for income-focused investors.
| Criteria | Rating | Score |
|---|---|---|
| Dividend yield | 1 | |
| Dividend Stability | 5 | |
| Dividend growth | 4 | |
| Payout ratio | 5 | |
| Financial stability | 4 | |
| Dividend continuity | 5 | |
| Cashflow Coverage | 4 | |
| Balance Sheet Quality | 4 |
Total Score: 32/40
🗣️ Rating
KLA Corporation stands out as a formidable dividend-paying entity, offering consistent growth and robust stability. Despite a comparatively modest yield, its strong financial foundation and comprehensive dividend history make it a recommended choice for investors targeting steady income supplemented by capital appreciation. KLAC’s commitment to increasing payouts over the years reflects an unwavering dedication to enhancing shareholder returns.
Smart Data Insight
Master the Perfect Entry & Exit for this Stock
Don't leave your profits to chance. Historically, this stock follows specific seasonal patterns that institutional traders use to maximize returns.
- ✅ Identify the "Golden Buying Window"
- ✅ Avoid high-risk correction cycles
- ✅ Backtested data from the last 20+ years