January 14, 2026 a 07:46 am
KLAC: Dividend Analysis - KLA Corporation
The KLA Corporation, with a robust market presence, showcases its commitment to shareholder returns through 21 years of dividend history. While the dividend yield stands modest, the consistent growth and low payout ratios highlight prudent financial management. These factors contribute to a sound investment, particularly for those focusing on dividend stability and gradual growth.
📊 Overview
The sector of KLA Corporation offers a specialized focus, with a dividend yield of 0.65%, a current dividend per share of 6.80 USD, and a 21-year historical dividend payment record. The last cut or suspension occurred a decade ago in 2015, an indication of consistent dividend policies.
| Sector | Dividend Yield (%) | Current Dividend/Share (USD) | Dividend History (years) | Last Cut/Suspension |
|---|---|---|---|---|
| 0.65% | 6.80 | 21 | 2015 |
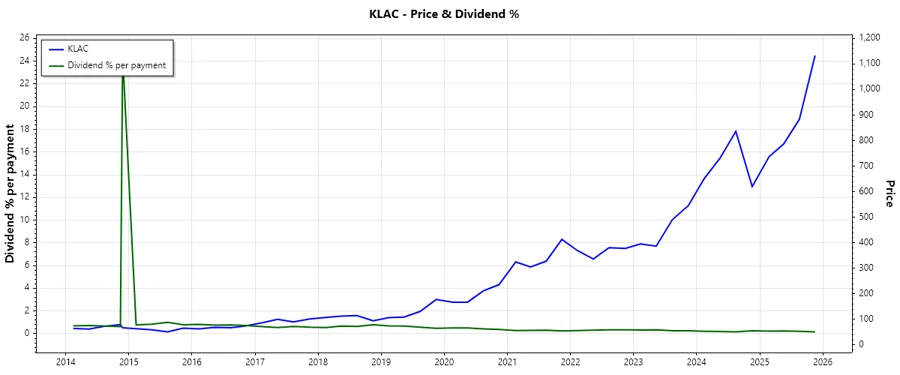
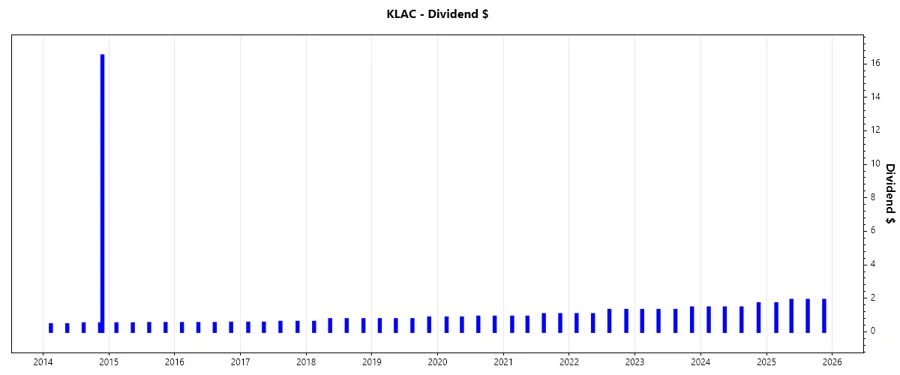
🗣️ Dividend History
Historically, KLA Corporation's commitment to dividends demonstrates stability. Consistent payouts are crucial for long-term investors seeking income assurance and potential capital gains through reinvestments.
| Year | Dividend per Share (USD) |
|---|---|
| 2025 | 7.4 |
| 2024 | 6.05 |
| 2023 | 5.35 |
| 2022 | 4.70 |
| 2021 | 3.90 |
📈 Dividend Growth
Dividend growth is a critical measure of financial health and management efficacy. For KLA, the 3-year and 5-year metrics reveal a steady commitment to increasing shareholder value.
| Time | Growth (%) |
|---|---|
| 3 Years | 16.34% |
| 5 Years | 16.15% |
The average dividend growth is 16.15% over 5 years. This shows moderate but steady dividend growth.
⚠️ Payout Ratio
The payout ratio offers insights into the sustainability of dividends. Analyzing these ratios is essential in assessing if earnings or cash flow can adequately cover dividend payouts.
| Key Figure | Ratio (%) |
|---|---|
| EPS-based | 21.15% |
| Free Cash Flow-based | 23.06% |
The low EPS-based (21.15%) and FCF-based (23.06%) payout ratios reflect a well-balanced dividend policy, indicating the dividends are well-covered by both earnings and cash flow.
✅ Cashflow & Capital Efficiency
Assessing cash flow and capital efficiency is vital for understanding operational effectiveness and return potential. These metrics help evaluate sustainability and the company's ability to invest.
| Year | 2023 | 2024 | 2025 |
|---|---|---|---|
| Free Cash Flow Yield | 4.92% | 2.71% | 3.14% |
| Earnings Yield | 5.01% | 2.47% | 3.41% |
| CAPEX to Operating Cash Flow | 9.31% | 8.34% | 8.79% |
| Stock-based Compensation to Revenue | 1.63% | 2.17% | 2.18% |
| Free Cash Flow / Operating Cash Flow Ratio | 90.69% | 91.62% | 91.67% |
These metrics indicate strong cash flow generation and capital efficiency, vital for supporting ongoing operations and funding growth initiatives.
📉 Balance Sheet & Leverage Analysis
Understanding balance sheet strength provides insight into a company's financial stability and risk profile, including its ability to meet obligations.
| Year | 2023 | 2024 | 2025 |
|---|---|---|---|
| Debt-to-Equity | 2.08 | 2.02 | 1.30 |
| Debt-to-Assets | 43.09% | 44.19% | 37.89% |
| Debt-to-Capital | 67.50% | 66.94% | 56.47% |
| Net Debt to EBITDA | 0.92 | 1.24 | 0.75 |
| Current Ratio | 2.24 | 2.15 | 2.62 |
| Quick Ratio | 1.47 | 1.50 | 1.83 |
| Financial Leverage | 4.82 | 4.58 | 3.42 |
The gradually decreasing leverage ratios and healthy current and quick ratios signify strong liquidity and adept financial management.
🗣️ Fundamental Strength & Profitability
Key profitability ratios reflect operational competence and efficiency in generating returns and managing costs, ensuring competitive positioning.
| Year | 2023 | 2024 | 2025 |
|---|---|---|---|
| Return on Equity | 116.01% | 81.99% | 86.56% |
| Return on Assets | 24.07% | 17.90% | 25.28% |
| Net Margin | 32.27% | 28.15% | 33.41% |
| EBIT Margin | 38.93% | 35.68% | 40.69% |
| EBITDA Margin | 42.89% | 39.78% | 43.93% |
| Gross Margin | 59.81% | 59.97% | 62.31% |
| Research & Development to Revenue | 12.35% | 13.03% | 11.15% |
These profitability metrics underscore KLA's robust capacity to generate high returns and maintain a margin advantage, bolstered by strategic R&D investments.
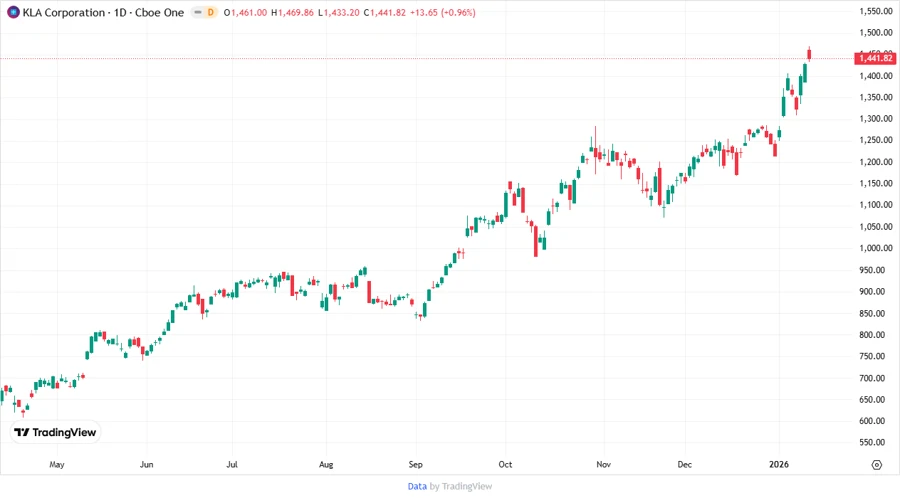
📈 Price Development
📊 Dividend Scoring System
| Category | Score | |
|---|---|---|
| Dividend Yield | 3 | |
| Dividend Stability | 5 | |
| Dividend Growth | 4 | |
| Payout Ratio | 5 | |
| Financial Stability | 4 | |
| Dividend Continuity | 5 | |
| Cashflow Coverage | 4 | |
| Balance Sheet Quality | 4 |
Total Score: 34/40
🗣️ Rating
KLA Corporation stands out as an exemplary dividend-paying stock due to its solid payout history, consistent growth, and financial prudence. With a commendable score of 34 out of 40, this stock is highly recommended for those seeking stable and growing dividends within a solid financial framework.