November 26, 2025 a 12:46 pm


KLAC: Dividend Analysis - KLA Corporation
KLA Corporation showcases a consistent dividend history with opportunities for growth. With a robust dividend yield and a commitment to shareholder returns, this analysis provides insights into its financial strategies and long-term prospects. Its market capital position strengths further reinforce its potential as a stable dividend-paying stock.
📊 Overview
| Metric | Value |
|---|---|
| Sector | Technology |
| Dividend yield | 0.65 % |
| Current dividend per share | 6.80 USD |
| Dividend history | 21 years |
| Last cut or suspension | 2015 |
🗣️ Dividend History
Maintaining a long-standing dividend history is crucial for investor confidence. KLA Corporation's consistency in dividend payments reflects strategic financial management and dedication to shareholder returns.
| Year | Dividend per share |
|---|---|
| 2025 | 7.40 USD |
| 2024 | 6.05 USD |
| 2023 | 5.35 USD |
| 2022 | 4.70 USD |
| 2021 | 3.90 USD |
📈 Dividend Growth
Assessing the growth in dividends over time provides insights into potential earnings growth and financial health. KLA Corporation's historical dividend growth signals robust financial management.
| Time | Growth |
|---|---|
| 3 years | 15.76 % |
| 5 years | 14.31 % |
The average dividend growth is 14.31 % over 5 years. This shows moderate but steady dividend growth.
✅ Payout Ratio
The payout ratio is a critical indicator of sustainable dividend distribution. Lower ratios often suggest capacity for dividend increases while maintaining financial health.
| Key figure | Ratio |
|---|---|
| EPS-based | 21.15 % |
| Free cash flow-based | 23.06 % |
With an EPS payout ratio of 21.15 % and an FCF payout ratio of 23.06 %, KLA Corporation retains ample earnings and cash flows, supporting dividend sustainability.
💼 Cashflow & Capital Efficiency
Analyzing cash flows and capital allocation aids in understanding the company’s financial flexibility and how efficiently it uses capital for returns.
| Year | 2025 | 2024 | 2023 |
|---|---|---|---|
| Free Cash Flow Yield | 3.14 % | 2.71 % | 4.92 % |
| Earnings Yield | 3.41 % | 2.47 % | 5.01 % |
| CAPEX to Operating Cash Flow | 8.79 % | 8.38 % | 9.31 % |
| Stock-based Compensation to Revenue | 2.18 % | 2.17 % | 1.63 % |
| Free Cash Flow / Operating Cash Flow Ratio | 91.67 % | 91.62 % | 90.69 % |
KLA Corporation's solid free cash flow and efficient capital usage indicate strong cash conversion ability and prudent financial practices.
📊 Balance Sheet & Leverage Analysis
Thorough balance sheet and leverage review ensures understanding of the company's debt strategy and liquidity management.
| Year | 2025 | 2024 | 2023 |
|---|---|---|---|
| Debt-to-Equity | 129.75 % | 202.46 % | 207.66 % |
| Debt-to-Assets | 37.89 % | 44.19 % | 43.09 % |
| Debt-to-Capital | 56.47 % | 66.94 % | 67.50 % |
| Net Debt to EBITDA | 0.73 | 1.24 | 0.92 |
| Current Ratio | 2.69 | --- | --- |
| Quick Ratio | 1.83 | 1.50 | 1.47 |
| Financial Leverage | 3.42 | 4.58 | 4.82 |
KLA Corporation's leverage ratios and liquidity measures are indicative of its capability to manage debt and sustain financial obligations efficiently.
📈 Fundamental Strength & Profitability
Examining profitability measures and efficiency in resource utilization provides insights into the company’s operational competence.
| Year | 2025 | 2024 | 2023 |
|---|---|---|---|
| Return on Equity | 86.56 % | 81.99 % | 116.01 % |
| Return on Assets | 25.28 % | 17.90 % | 24.07 % |
| Margins: Net | 33.41 % | 28.15 % | 32.27 % |
| Margins: EBIT | 40.69 % | 35.68 % | 38.93 % |
| Margins: EBITDA | 43.93 % | 39.82 % | 42.89 % |
| Margins: Gross | 62.32 % | 59.97 % | 59.81 % |
| R&D to Revenue | 11.16 % | 13.03 % | 12.35 % |
KLA Corporation's high profitability margins and returns demonstrate efficient operations and an ability to generate shareholder value.
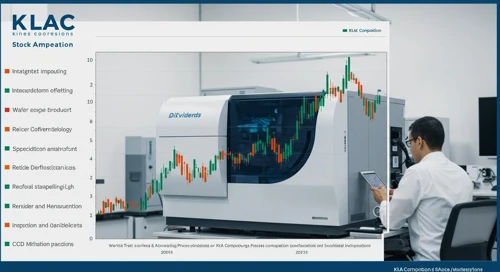
📉 Price Development
🏆 Dividend Scoring System
| Criterion | Score | Score Bar |
|---|---|---|
| Dividend yield | 3 | |
| Dividend Stability | 4 | |
| Dividend growth | 5 | |
| Payout ratio | 5 | |
| Financial stability | 4 | |
| Dividend continuity | 4 | |
| Cashflow Coverage | 3 | |
| Balance Sheet Quality | 4 |
Total Score: 32/40
⭐ Rating
Overall, KLA Corporation is a fundamentally strong company with a sound dividend profile. Its stable and growing dividends, along with prudent financial management, make it an appealing choice for income-oriented investors. The company earns a favorable recommendation for its potential in sustaining shareholder value through dividends.