October 29, 2025 a 07:31 am


KLAC: Dividend Analysis - KLA Corporation
KLA Corporation demonstrates a robust performance in dividend payments with a consistent growing dividend yield, exhibiting a remarkable history of 21 years without any suspensions. The company's strategic emphasis on maintaining a healthy payout ratio and ensuring dividend continuity underscores a commitment towards rewarding shareholders while supporting long-term financial sustainability.
📊 Overview
KLA Corporation operates within the technology sector, offering a relatively modest dividend yield of 0.82%, complemented by a stable dividend per share at 6.80 USD. With an impressive dividend history spanning 21 years, the firm has yet never resorted to cutting or suspending dividends, indicating robust financial health and shareholder-centric fiscal policies.
| Metric | Value |
|---|---|
| Sector | Technology |
| Dividend Yield | 0.82% |
| Current Dividend per Share | 6.80 USD |
| Dividend History | 21 years |
| Last Cut or Suspension | None |
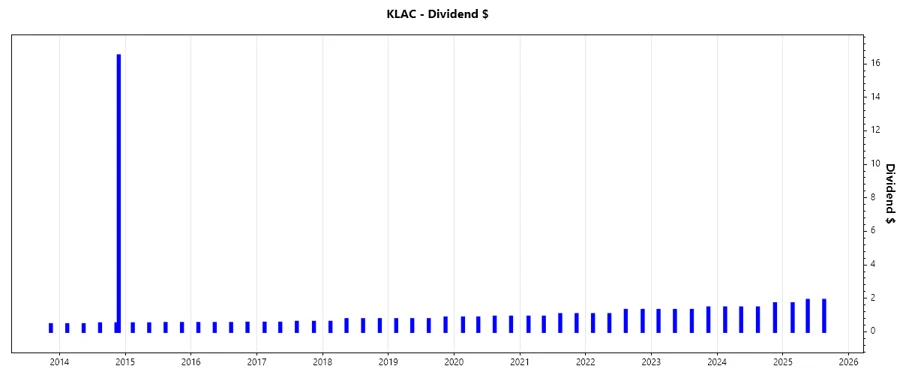
🗣️ Dividend History
The lengthy history of dividend payments highlights KLA's consistency and ability to allocate profits effectively while maintaining shareholder satisfaction. A reliable track record like this establishes company credibility and encourages investment confidence.
| Year | Dividend per Share |
|---|---|
| 2025 | 5.5 USD |
| 2024 | 6.05 USD |
| 2023 | 5.35 USD |
| 2022 | 4.70 USD |
| 2021 | 3.90 USD |
📈 Dividend Growth
Growth potential is a critical evaluative aspect in dividend analysis. KLA has demonstrated a notable growth in its dividends, with a 3-year growth rate of 15.76% and a 5-year growth rate of 14.31%, which reflects a strong capacity for consistent financial improvement.
| Time | Growth |
|---|---|
| 3 years | 15.76% |
| 5 years | 14.31% |
The average dividend growth is 14.31% over 5 years. This shows moderate but steady dividend growth.
✅ Payout Ratio
The payout ratios are insightful indicators of how earnings and cash flows are distributed. KLA boasts a prudent EPS-based payout ratio of 22.10% and a cash flow-based payout ratio of 23.97%, suggesting that the dividends are well-supported by earnings and cash flow, minimizing any payout-related risks.
| Key Figure | Ratio |
|---|---|
| EPS-based | 22.10% |
| Free cash flow-based | 23.97% |
The EPS payout ratio of 22.10% and the FCF payout ratio of 23.97% comfortably align with the company's dividend sustainability, ensuring earnings coverage remains strong.
⚠️ Cashflow & Capital Efficiency
Cash flow metrics provide a deeper understanding of operational efficiency and financial flexibility. Analyzing free cash flow and capital efficiency reveals KLA's capacity to generate and maintain financial vigor amid growth investments.
| Metric | 2023 | 2024 | 2025 |
|---|---|---|---|
| Free Cash Flow Yield | 4.92% | 2.71% | 3.14% |
| Earnings Yield | 5.01% | 2.47% | 3.41% |
| CAPEX to Operating Cash Flow | 9.31% | 8.38% | 8.28% |
| Stock-based Compensation to Revenue | 1.63% | 2.17% | 2.18% |
| Free Cash Flow / Operating Cash Flow Ratio | 90.69% | 91.62% | 91.67% |
Analyzed data indicates that KLA continues to maintain significant capital efficiency, ensuring optimal resource allocation and supporting long-term profitability despite moderate variations in cash flow activities.
💼 Balance Sheet & Leverage Analysis
Evaluating leverage metrics is crucial for assessing long-term sustainability. KLA’s strategic management of leverage ratios indicates a strong emphasis on maintaining solvency and liquidity, necessary for robust financial health.
| Metric | 2023 | 2024 | 2025 |
|---|---|---|---|
| Debt-to-Equity | 207.66% | 202.46% | 129.75% |
| Debt-to-Assets | 43.09% | 44.19% | 37.89% |
| Debt-to-Capital | 67.50% | 66.94% | 56.47% |
| Net Debt to EBITDA | 0.92 | 1.24 | 0.75 |
| Current Ratio | 2.24 | 2.15 | 2.62 |
| Quick Ratio | 1.47 | 1.50 | 1.83 |
| Financial Leverage | 482% | 458% | 342% |
Despite substantial leverage, KLA’s debt management strategy is designed to enhance financial flexibility without compromising liquidity, thus showcasing a sound and stable operational backbone.
📉 Fundamental Strength & Profitability
These metrics reveal core operational strength. High returns on equity and assets reinforce the firm’s efficiency in utilizing shareholders’ equity and its ability to generate profit, while substantial margins further emphasize efficient cost management.
| Metric | 2023 | 2024 | 2025 |
|---|---|---|---|
| Return on Equity | 116.01% | 81.99% | 86.56% |
| Return on Assets | 24.07% | 17.89% | 25.28% |
| Net Profit Margin | 32.27% | 28.15% | 33.41% |
| EBIT Margin | 38.93% | 35.68% | 40.69% |
| EBITDA Margin | 42.89% | 39.82% | 43.93% |
| Gross Margin | 59.81% | 59.97% | 62.32% |
| Research & Development to Revenue | 12.35% | 13.03% | 11.15% |
KLA's profitability metrics are indicative of a competitive and financially efficient enterprise, with its strong ROE and profit margins affirming outstanding operational efficiency.
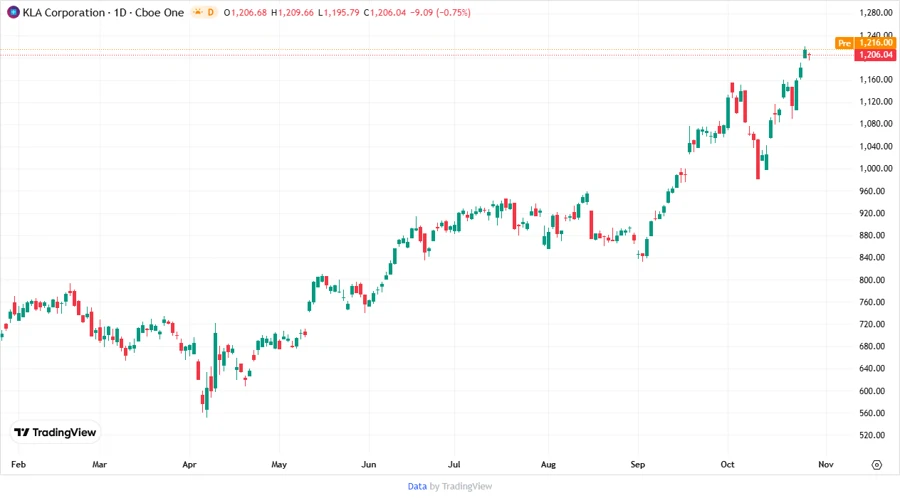
Price Development
🌟 Dividend Scoring System
| Category | Score | Visual |
|---|---|---|
| Dividend Yield | 3 | |
| Dividend Stability | 5 | |
| Dividend Growth | 4 | |
| Payout Ratio | 5 | |
| Financial Stability | 4 | |
| Dividend Continuity | 5 | |
| Cashflow Coverage | 4 | |
| Balance Sheet Quality | 4 |
Total Score: 34/40
🗒️ Rating
Overall, KLA Corporation presents a compelling case for both existing and potential investors with its strong dividend history, moderate growth outlook, and robust financial health. The well managed payout ratios, alongside its formidable fundamental strength and strategic leverage management, position the company as a reliable dividend investment option with a calculated growth trajectory. Investors seeking stable returns with growth potential may find KLA Corporation a worthy addition to their portfolios.
Smart Data Insight
Master the Perfect Entry & Exit for this Stock
Don't leave your profits to chance. Historically, this stock follows specific seasonal patterns that institutional traders use to maximize returns.
- ✅ Identify the "Golden Buying Window"
- ✅ Avoid high-risk correction cycles
- ✅ Backtested data from the last 20+ years