September 04, 2025 a 11:32 am

KLAC: Dividend Analysis - KLA Corporation
The dividend profile of KLA Corporation exemplifies a resilient and consistent growth trajectory, highlighted by a robust dividend history spanning over two decades. With stable payout ratios and a commitment to incremental increase, KLA offers a compelling choice for income-focused investors. Despite a modest dividend yield, the consistency in dividend payouts, compounded with its growth potential, presents KLA as a balance between income and value growth.
📊 Overview
KLA Corporation is a prominent entity within its sector, exemplifying a stable and secured dividend protocol. The company boasts a commendable dividend consistency, reflected in its long-standing historical record and calculated distribution strategies. Here is a summary of their current position:
| Sector | Dividend Yield | Current Dividend per Share | Dividend History | Last Dividend Cut/Suspension |
|---|---|---|---|---|
| Tech Manufacturing | 0.82% | 6.80 USD | 21 years | None |
📈 Dividend History
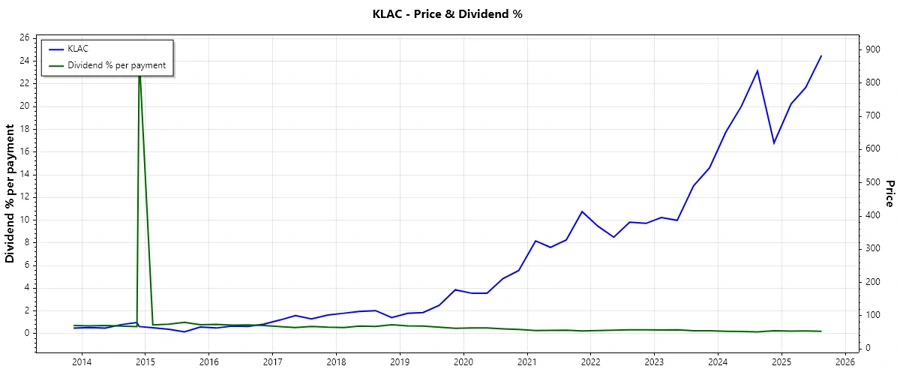
The longevity of KLA's dividend history underscores its financial fortitude. With dividends distributed consistently over the last 21 years, KLA illustrates a reliable income strategy for its shareholders. The absence of any recent cuts further cements trust in their financial policies.
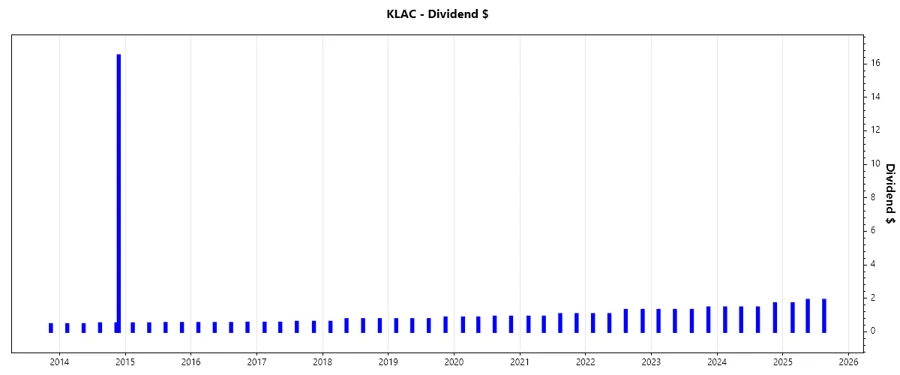
The following chart provides a visual representation of the firm's dividend trajectory:
| Year | Dividend Per Share |
|---|---|
| 2025 | 5.50 USD |
| 2024 | 6.05 USD |
| 2023 | 5.35 USD |
| 2022 | 4.70 USD |
| 2021 | 3.90 USD |
📉 Dividend Growth
Examining the growth patterns of dividends reveals KLA's commitment to enhancing shareholder value. Over three and five-year periods respectively, the company's strategy demonstrates primarily stable and sustainable increments. This growth offers investors an indication of KLA's future financial health and potential for maintained payout enhancements.
| Time | Growth |
|---|---|
| 3 years | 15.76% |
| 5 years | 14.31% |
The average dividend growth is 14.31% over 5 years. This shows moderate but steady dividend growth.
✅ Payout Ratio
A bounded payout ratio indicates strong financial discipline, preserving the potential for future growth and stability in distributions. KLA maintains this discipline with its meticulous approach to earnings and free cash flows distribution:
| Key Figure | Ratio |
|---|---|
| EPS-based | 22.10% |
| Free cash flow-based | 23.97% |
With an EPS payout ratio of 22.10% and a free cash flow payout ratio of 23.97%, KLA demonstrates a conservative payout strategy, allowing room for reinvestment in growth and a hedge against potential economic downturns.
Cashflow & Capital Efficiency
A measured approach to cash flow and capital efficiency is vital for operational endurance and investor confidence. KLA's cash flow metrics allude to effective resource allocation and robustness in cash flow generation.
| Metric | 2025 | 2024 | 2023 |
|---|---|---|---|
| Free Cash Flow Yield | 3.14% | 2.71% | 4.92% |
| Earnings Yield | 3.41% | 2.47% | 5.01% |
| CAPEX to Operating Cash Flow | 8.28% | 8.38% | 9.31% |
| Stock-based Compensation to Revenue | 2.18% | 2.17% | 1.63% |
| Free Cash Flow / Operating Cash Flow Ratio | 91.67% | 91.62% | 90.69% |
KLA's metrics highlight effective cash utilization and capital reinvestment strategies, underpinning its ability to sustain operations and continue shareholder distributions.
Balance Sheet & Leverage Analysis
Financial health and leverage ratios afford critical insights into a company's ability to manage debt and sustain operations through variable conditions. KLA's balance sheet reflects prudent management of debts:
| Metric | 2025 | 2024 | 2023 |
|---|---|---|---|
| Debt-to-Equity | 1.25 | 2.02 | 2.08 |
| Debt-to-Assets | 0.37 | 0.44 | 0.43 |
| Debt-to-Capital | 0.56 | 0.67 | 0.67 |
| Net Debt to EBITDA | 0.72 | 1.24 | 0.92 |
| Current Ratio | 2.62 | 2.15 | 2.24 |
| Quick Ratio | 1.83 | 1.50 | 1.47 |
| Financial Leverage | 3.42 | 4.58 | 4.82 |
The provision of liquidity and capital efficiency comes through a disciplined financial structure, with balanced debt ratios facilitating operational adaptability for KLA.
Fundamental Strength & Profitability
KLA's fundamental performance metrics are pivotal in assessing the sustainability of returns and strategic positioning within its market.
| Metric | 2025 | 2024 | 2023 |
|---|---|---|---|
| Return on Equity | 86.56% | 81.99% | 116.01% |
| Return on Assets | 25.28% | 17.90% | 24.07% |
| Margins: Net | 33.41% | 28.15% | 32.27% |
| EBIT Margin | 40.69% | 35.68% | 38.93% |
| EBITDA Margin | 40.69% | 39.82% | 42.89% |
| Gross Margin | 62.32% | 59.97% | 59.81% |
| R&D to Revenue | 11.15% | 13.03% | 12.35% |
KLA's strong returns and efficient margins underscore a competitive edge and reinforce its capacity for sustained growth and profitability.
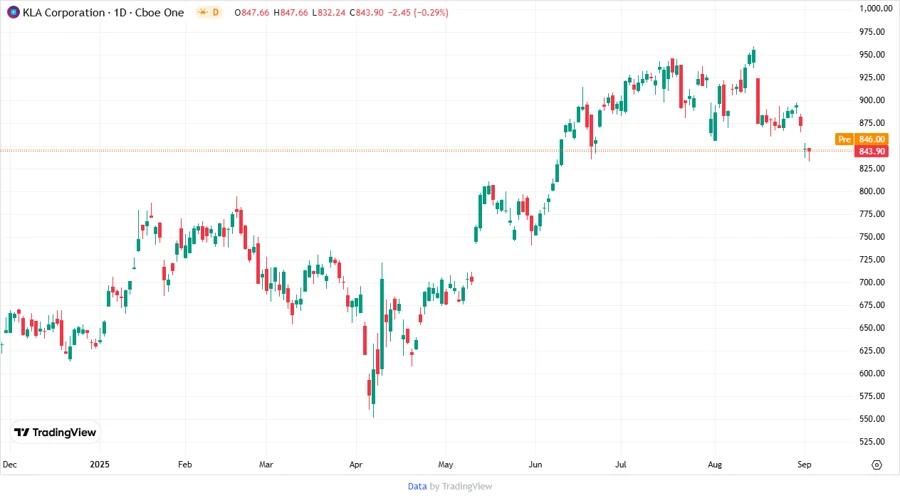
Price Development
🗣️ Dividend Scoring System
This scoring system evaluates KLA on various aspects relevant to dividend health and overall financial stability:
| Criterion | Score | Score Indicator |
|---|---|---|
| Dividend Yield | 3 | |
| Dividend Stability | 5 | |
| Dividend Growth | 4 | |
| Payout Ratio | 4 | |
| Financial Stability | 4 | |
| Dividend Continuity | 5 | |
| Cashflow Coverage | 4 | |
| Balance Sheet Quality | 4 |
Total Score: 33/40
Rating
Overall, KLA Corporation presents as a robust candidate within the dividend stock domain, exhibiting strong financial stability, commendable dividend continuity, and competitive growth characteristics. The company's prudent management approaches sustain its ability to upscale shareholder rewards. Recommended for investors seeking a balance of yield and growth potential, KLA maintains a resilient investment case within today's evolving market landscape.
Smart Data Insight
Master the Perfect Entry & Exit for this Stock
Don't leave your profits to chance. Historically, this stock follows specific seasonal patterns that institutional traders use to maximize returns.
- ✅ Identify the "Golden Buying Window"
- ✅ Avoid high-risk correction cycles
- ✅ Backtested data from the last 20+ years