July 07, 2025 a 07:31 am


KLAC: Dividend Analysis - KLA Corporation
KLA Corporation offers a robust dividend profile with consistent growth over more than two decades. The long-standing history of uninterrupted dividend payments highlights the company’s financial discipline and shareholder focus. Their competitive dividend yield, supported by substantial cash flows, demonstrates commitment to returning capital to shareholders, making them an attractive proposition for income-focused investors.
📊 Overview
KLA Corporation stands as a beacon of stability within its sector, reflecting its commitment to shareholder returns.
| Metric | Value |
|---|---|
| Sector | Technology |
| Dividend yield | 0.86% |
| Current dividend per share | 5.71 USD |
| Dividend history | 21 years |
| Last cut or suspension | None |
🗣️ Dividend History
The dividend history of KLA Corporation demonstrates its resilience and commitment to consistent shareholder returns. Tracking these payments is crucial for predicting the company's ability to sustain or increase its dividends.
| Year | Dividend per Share (USD) |
|---|---|
| 2025 | 3.60 |
| 2024 | 6.05 |
| 2023 | 5.35 |
| 2022 | 4.70 |
| 2021 | 3.90 |
📈 Dividend Growth
Analyzing dividend growth offers insights into future income potential and financial health. Steady growth over the years points to robust cash flow and a shareholder-friendly management strategy.
| Time | Growth |
|---|---|
| 3 years | 15.8% |
| 5 years | 14.3% |
The average dividend growth is 14.3% over 5 years. This shows moderate but steady dividend growth.
💸 Payout Ratio
Payout ratios are essential indicators of dividend sustainability. A low payout ratio indicates room for dividend growth and financial resilience.
| Key figure ratio | Percentage |
|---|---|
| EPS-based | 20.50% |
| Free cash flow-based | 21.49% |
The low payout ratios, with 20.50% based on EPS and 21.49% on Free Cash Flow, suggest a strong ability to maintain or increase dividends, reflecting sound financial health.
💰 Cashflow & Capital Efficiency
Cash flow metrics matter as they provide insights into the company’s ability to generate cash and reinvest profits for growth or return capital to shareholders.
| Metric | 2022 | 2023 | 2024 |
|---|---|---|---|
| Free Cash Flow Yield | 6.26% | 4.92% | 2.71% |
| Earnings Yield | 6.92% | 5.01% | 2.47% |
| CAPEX to Operating Cash Flow | 9.28% | 9.31% | 8.38% |
| Stock-based Compensation to Revenue | 1.38% | 1.63% | 2.17% |
| Free Cash Flow / Operating Cash Flow Ratio | 90.72% | 90.69% | 91.62% |
KLA Corporation's cash flow stability is underscored by a robust free cash flow to operating cash flow ratio. This, along with strong earnings yields, highlights capital efficiency and shareholder value creation.
📉 Balance Sheet & Leverage Analysis
The balance sheet metrics reveal the company’s capital structure and its ability to manage debt, which is vital for assessing long-term financial stability.
| Metric | 2022 | 2023 | 2024 |
|---|---|---|---|
| Debt-to-Equity | 4.75 | 2.02 | 2.02 |
| Debt-to-Assets | 52.88% | 41.86% | 44.19% |
| Debt-to-Capital | 82.62% | 66.86% | 66.94% |
| Net Debt to EBITDA | 1.26 | 0.90 | 1.24 |
| Current Ratio | 2.50 | 2.24 | 2.15 |
| Quick Ratio | 1.75 | 1.47 | 1.50 |
| Financial Leverage | 8.99 | 4.82 | 4.58 |
The decline in debt-to-equity from 2022 to 2024, coupled with stable leverage ratios, suggests improved balance sheet strength and reduced financial risk.
✅ Fundamental Strength & Profitability
Fundamental metrics like Return on Equity and Margins provide insights into profitability and operational efficiency, crucial for evaluating investment quality.
| Metric | 2022 | 2023 | 2024 |
|---|---|---|---|
| Return on Equity | 237.04% | 116.01% | 81.99% |
| Return on Assets | 26.37% | 24.07% | 17.90% |
| Net Profit Margin | 36.06% | 32.27% | 28.15% |
| EBIT Margin | 39.62% | 38.93% | 35.68% |
| EBITDA Margin | 43.56% | 41.99% | 39.82% |
| Gross Margin | 61.00% | 59.81% | 59.97% |
| Research & Development to Revenue | 11.99% | 12.35% | 13.03% |
KLA Corporation’s solid profitability metrics highlight effective management practices and the ability to generate significant returns on equity, although recent figures show some decline.
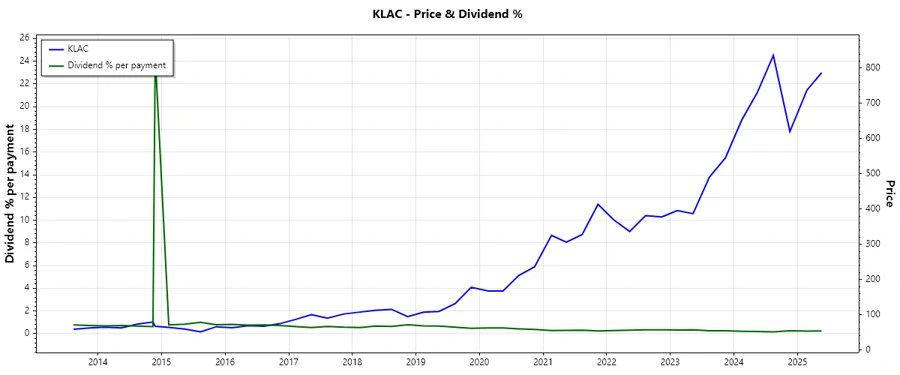
📊 Price Development
🔢 Dividend Scoring System
| Category | Score | Analysis |
|---|---|---|
| Dividend yield | 3/5 | |
| Dividend Stability | 5/5 | |
| Dividend growth | 4/5 | |
| Payout ratio | 4/5 | |
| Financial stability | 4/5 | |
| Dividend continuity | 5/5 | |
| Cashflow Coverage | 4/5 | |
| Balance Sheet Quality | 3/5 |
Overall Score: 32/40
📈 Rating
KLA Corporation presents a strong dividend profile with consistent growth, robust cash flow coverage, and high dividend stability. This enhances its appeal for long-term, dividend-seeking investors. While the dividend yield might not be the highest, the growth potential and reliability promise attractive total returns. Financial metrics attest to its solid management and operational efficiency.
Smart Data Insight
Master the Perfect Entry & Exit for this Stock
Don't leave your profits to chance. Historically, this stock follows specific seasonal patterns that institutional traders use to maximize returns.
- ✅ Identify the "Golden Buying Window"
- ✅ Avoid high-risk correction cycles
- ✅ Backtested data from the last 20+ years