
June 17, 2026 a 01:15 pm
KKR: Trend and Support & Resistance Analysis - KKR & Co. Inc.
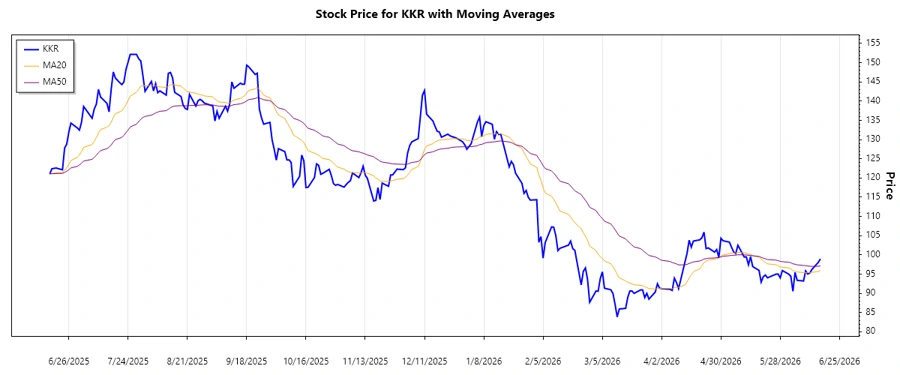
KKR & Co. Inc., a global investment leader, is demonstrating a moderate trend in its stock prices. Recent data highlights a potential for growth, backed by strategic expansions in various sectors. However, careful monitoring of key technical indicators is advised for investors considering position adjustments in the near term. The firm's robust business model across diverse industries continues to provide a strong foundation amidst market fluctuations.
Trend Analysis
| Date | Closing Price | Trend |
|---|---|---|
| 2026-06-16 | $98.97 | ▲ Uptrend |
| 2026-06-15 | $98.08 | ▲ Uptrend |
| 2026-06-12 | $96.24 | ▲ Uptrend |
| 2026-06-11 | $95.30 | ▲ Uptrend |
| 2026-06-10 | $95.02 | ▼ Downtrend |
| 2026-06-09 | $95.84 | ▼ Downtrend |
| 2026-06-08 | $93.21 | ▼ Downtrend |
The weighted EMAs suggest an overall ▲ Uptrend, as the EMA20 surpasses the EMA50, indicating potential bullish movements.
Support- and Resistance
| Support Zone | Resistance Zone |
|---|---|
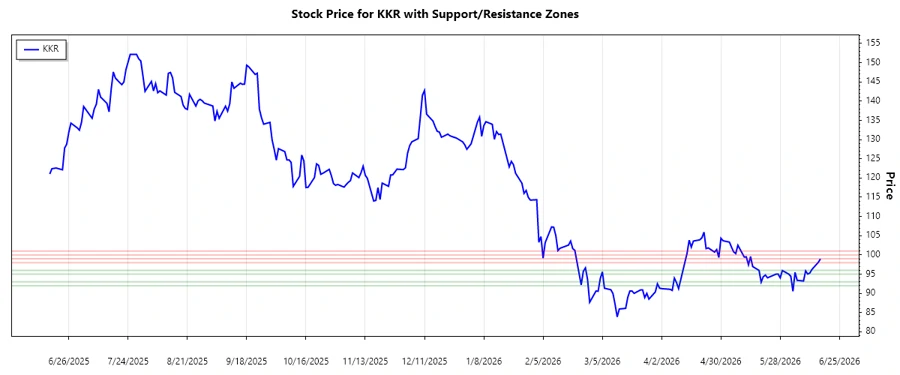
| Support Zone: $95.00 - $96.00 | Resistance Zone: $98.00 - $99.00 |
| Support Zone: $92.00 - $93.00 | Resistance Zone: $100.00 - $101.00 |
The current stock price is hovering within the $95.00 - $96.00 support zone. This indicates a potential rebound zone, with significant resistance ahead.
Conclusion
KKR's stock is exhibiting a minor uptrend, likely to continue if support levels hold. Given the recent analysis, investors should be watchful of nearing resistance zones which may trigger short-term reversals. The company's wide-ranging growth strategies across key sectors provide a buffer against market uncertainties. However, careful attention to the stock's performance relative to identified support and resistance zones is crucial for timely investment decisions.
Smart Data Insight
Master the Perfect Entry & Exit for this Stock
Don't leave your profits to chance. Historically, this stock follows specific seasonal patterns that institutional traders use to maximize returns.
- ✅ Identify the "Golden Buying Window"
- ✅ Avoid high-risk correction cycles
- ✅ Backtested data from the last 20+ years