May 05, 2026 a 03:30 pm

KKR: Dividend Analysis - KKR & Co. Inc.
KKR & Co. Inc. offers an intriguing prospective for dividend-oriented investors. The firm's track record of steady dividend payments over 17 years showcases resilience and commitment to returning value to shareholders. With a modest yield of 0.72%, and recent growth in dividend payments, KKR appears to be a blend of stability and potential. Yet, a discerning look into other financial metrics is vital to paint a clearer picture of its dividends' sustainability.
📊 Overview
KKR operates primarily in the financial sector, with a current dividend yield of 0.7216%, indicating its focus on returning value to shareholders. The company's current dividend per share is 0.86 USD. KKR has a robust dividend history, maintaining distributions over 17 years, without any significant suspension or cuts.
| Metric | Value |
|---|---|
| Sector | Financials |
| Dividend yield | 0.7216 % |
| Current dividend per share | 0.86 USD |
| Dividend history | 17 years |
| Last cut or suspension | None |
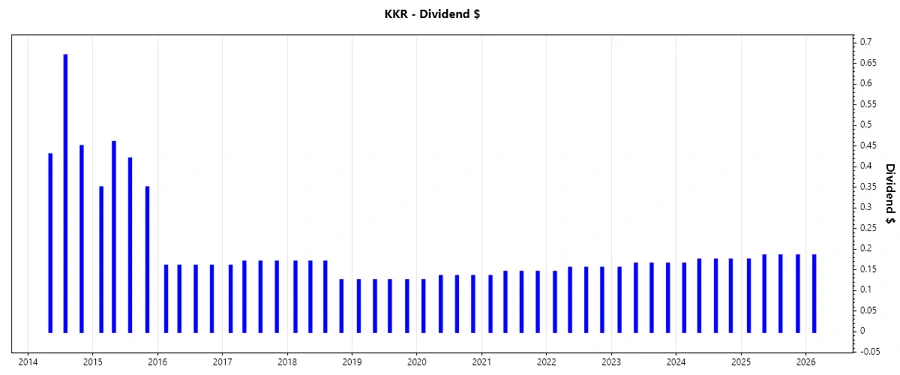
🗣️ Dividend History
Analyzing KKR's historical dividend payments is crucial in evaluating the reliability and stability of its dividends. Consistent dividends over long periods suggest a company's commitment to its shareholders.
| Year | Dividend Per Share (USD) |
|---|---|
| 2026 | 0.185 |
| 2025 | 0.730 |
| 2024 | 0.690 |
| 2023 | 0.650 |
| 2022 | 0.610 |
📈 Dividend Growth
Examining dividend growth over time helps determine a firm's prospects for future income. KKR has achieved a 6.13% growth rate over the last 3 years and 6.61% over 5 years.
| Time | Growth |
|---|---|
| 3 years | 6.17 % |
| 5 years | 6.61 % |
The average dividend growth is 6.61% over 5 years. This shows moderate but steady dividend growth.
📉 Payout Ratio
The payout ratio indicates the proportion of earnings paid as dividends, critical for assessing dividend sustainability. KKR has a payout ratio of 32.46% based on EPS and 10.23% based on FCF.
| Key figure | Ratio |
|---|---|
| EPS-based | 32.46 % |
| Free cash flow-based | 10.23 % |
Low payout ratios suggest KKR has ample earnings to cover its dividends, enhancing the likelihood of sustained payouts.
✅ Cashflow & Capital Efficiency
Cash flow and capital efficiency metrics provide insights into cash generation and reinvestment strategies. They are pivotal for evaluating KKR's capability to sustain dividend payments. Below is the representation:
| Year | 2023 | 2024 | 2025 |
|---|---|---|---|
| Free Cash Flow Yield | -2.23% | 4.96% | 8.39% |
| Earnings Yield | 5.19% | 2.34% | 2.08% |
| CAPEX to Operating Cash Flow | -7.26% | 2.13% | 1.66% |
| Stock-based Compensation to Revenue | 4.31% | 3.45% | 3.20% |
| Free Cash Flow / Operating Cash Flow Ratio | 107.26% | 97.87% | 98.34% |
These metrics affirm KKR's ability to generate and manage cash efficiently, supporting its dividend payments.
🔍 Balance Sheet & Leverage Analysis
A strong balance sheet is crucial for a company's financial health and its capacity to pay dividends. Key leverage indicators include:
| Year | 2023 | 2024 | 2025 |
|---|---|---|---|
| Debt-to-Equity | 2.16 | 2.15 | 1.77 |
| Debt-to-Assets | 0.16 | 0.14 | 0.13 |
| Debt-to-Capital | 0.68 | 0.68 | 0.64 |
| Net Debt to EBITDA | 3.06 | 3.92 | 7.69 |
| Current Ratio | 4.71 | 4.12 | 79.85 |
| Quick Ratio | 4.71 | 4.12 | 79.85 |
| Financial Leverage | 13.88 | 15.23 | 13.27 |
These ratios reveal KKR's robust debt management strategies, ensuring financial stability.
📌 Fundamental Strength & Profitability
Assessing profitability and fundamental strength provides insights into a firm’s efficiency and performance, directly impacting dividend policies.
| Year | 2023 | 2024 | 2025 |
|---|---|---|---|
| Return on Equity | 16.33% | 13.01% | 7.67% |
| Return on Assets | 1.18% | 0.85% | 0.58% |
| Margins: Net | 26.06% | 14.22% | 12.31% |
| EBIT Margin | 66.33% | 42.36% | 36.99% |
| EBITDA Margin | 66.33% | 42.36% | 36.99% |
| Gross Margin | 33.94% | 17.75% | 41.82% |
| Research & Development to Revenue | 0% | 0% | 0% |
KKR demonstrates solid profitability, significantly contributing to its ability to continue paying dividends.
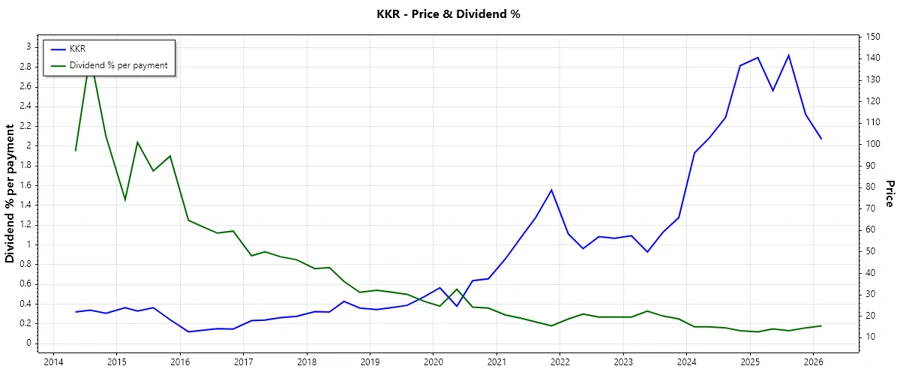
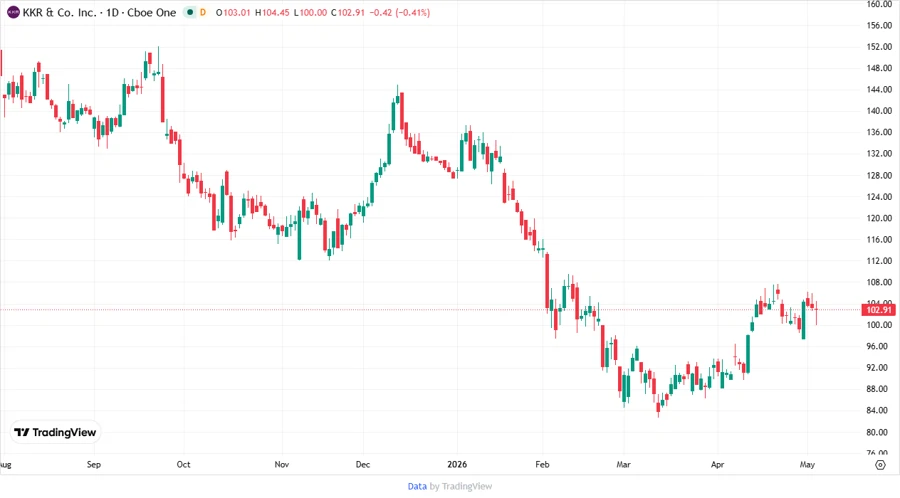
📉 Price Development
🔗 Dividend Scoring System
| Criteria | Score | |
|---|---|---|
| Dividend yield | 3 | |
| Dividend Stability | 4 | |
| Dividend growth | 4 | |
| Payout ratio | 5 | |
| Financial stability | 3 | |
| Dividend continuity | 5 | |
| Cashflow Coverage | 4 | |
| Balance Sheet Quality | 3 |
Total Score: 31/40
🔔 Rating
KKR & Co. Inc. presents a stable dividend profile, characterized by a low payout ratio and consistent growth over years. This marks it as a solid choice for consistent income, albeit with moderate returns. Financial and balance sheet stability further reinforces its capacity for reliable dividends, making it suitable for long-term, value-focused investors.
Smart Data Insight
Master the Perfect Entry & Exit for this Stock
Don't leave your profits to chance. Historically, this stock follows specific seasonal patterns that institutional traders use to maximize returns.
- ✅ Identify the "Golden Buying Window"
- ✅ Avoid high-risk correction cycles
- ✅ Backtested data from the last 20+ years