October 26, 2025 a 12:46 pm


KKR: Dividend Analysis - KKR & Co. Inc.
📊 KKR presents a compelling case for dividend-focused investors. With a 16-year history of dividend payouts and a current yield just over 0.5%, KKR continues to reward its shareholders. Despite market fluctuations, their dividend growth remains positive over both 3 and 5 years, demonstrating stability and commitment. However, potential investors should weigh the moderate yield against other financial metrics for a balanced view.
Overview
🗣️ KKR operates in the Financial Services sector, primarily focusing on investment and asset management. The current dividend yield stands at 0.51%, reflecting a relatively modest return on investment for dividend-seeking investors. The company has consistently paid out dividends for 16 years, with no recent cuts or suspensions, which underscores its commitment to providing shareholder value. The current dividend per share is approximately $0.69.
| Metric | Value |
|---|---|
| Sector | Financial Services |
| Dividend Yield | 0.51% |
| Current Dividend per Share | $0.69 |
| Dividend History | 16 years |
| Last Cut or Suspension | None |
Dividend History
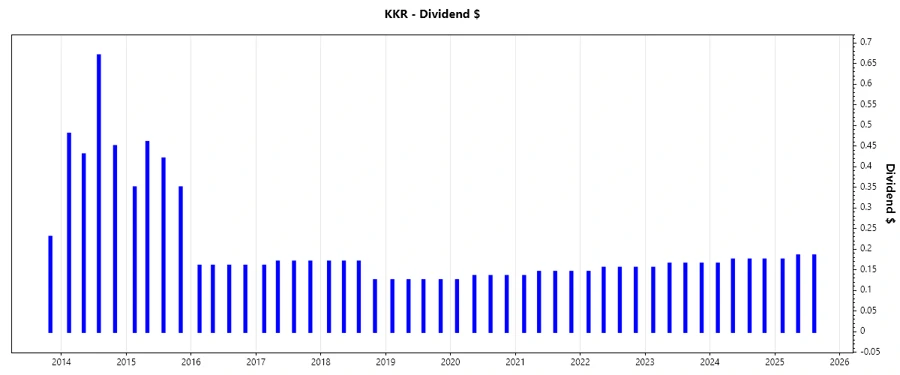
📈 KKR's ability to sustain and grow its dividends over time is crucial for assessing its long-term viability and attractiveness. The past year's distributions demonstrate stability, with subtle growth rates that reflect consistent performance even during economic uncertainties.
| Year | Dividend per Share (USD) |
|---|---|
| 2025 | 0.545 |
| 2024 | 0.690 |
| 2023 | 0.650 |
| 2022 | 0.610 |
| 2021 | 0.570 |
Dividend Growth
📉 Understanding dividend growth is essential for forecasting future returns. KKR reports a 3-year growth rate of approximately 6.58% and a 5-year rate of 6.65%, showcasing consistent upward trends. Historically, such metrics indicate a commitment to enhancing shareholder value.
| Time | Growth |
|---|---|
| 3 years | 6.58% |
| 5 years | 6.65% |
The average dividend growth is 6.65% over 5 years. This shows moderate but steady dividend growth.
Payout Ratio
✅ Analyzing payout ratios helps gauge the sustainability of a company's dividends. KKR's EPS-based payout ratio is around 30%, while the free cash flow-based ratio is approximately 13.46%. These figures suggest that KKR comfortably covers its payouts without overextending its financial resources, indicating a healthy dividend policy.
| Key Figure | Ratio |
|---|---|
| EPS-based | 30% |
| Free cash flow-based | 13.46% |
Cashflow & Capital Efficiency
⚠️ Cashflow metrics provide insights into operational efficiency and capital management. Over the years, KKR's free cash flow yield, earnings yield, and fund allocations like CAPEX reveal its strategic focus on cash flow stability. The company maintains satisfactory levels of capital efficiency, with a consistent free cash flow to operating cash flow ratio. This indicates strong cash generation capabilities necessary for ongoing investments and shareholder returns.
| 2024 | 2023 | 2022 | |
|---|---|---|---|
| Free Cash Flow Yield | 4.96% | -2.23% | -15.42% |
| Earnings Yield | 2.34% | 5.19% | -1.50% |
| CAPEX to Operating Cash Flow | 2.13% | -7.26% | -1.61% |
| Stock-based Compensation to Revenue | 3.45% | 4.32% | 13.12% |
| Free Cash Flow / Operating Cash Flow Ratio | 97.87% | 107.26% | 101.61% |
Balance Sheet & Leverage Analysis
📈 A comprehensive leverage analysis underscores KKR’s ability to manage and fulfill its debt obligations. Examining ratios such as Debt-to-Equity and Debt-to-Capital reveals KKR’s extensive use of leverage to enhance shareholder value. However, a Net Debt to EBITDA ratio near 4 suggests that debt levels could impose some risks during economic downturns but remain manageable under normal conditions.
| 2024 | 2023 | 2022 | |
|---|---|---|---|
| Debt-to-Equity | 2.15 | 2.16 | 2.34 |
| Debt-to-Assets | 14.11% | 15.57% | 16.01% |
| Debt-to-Capital | 68.24% | 68.36% | 70.09% |
| Net Debt to EBITDA | 3.92 | 3.05 | 23.22 |
| Current Ratio | 4.12 | 4.71 | 1.49 |
| Quick Ratio | 4.12 | 4.71 | 1.49 |
| Financial Leverage | 15.23 | 13.88 | 14.64 |
Fundamental Strength & Profitability
🗣️ Viewing KKR’s profitability and fundamental strength metrics, substantial growth and return indicators provide investors confidence in future earnings potential. While Return on Equity (ROE) and Return on Assets (ROA) demonstrate KKR’s effective capital employment, various margin measures indicate solid profitability despite evolving market conditions. Such robustness roots the foundation for sustained competitive standing.
| 2024 | 2023 | 2022 | |
|---|---|---|---|
| Return on Equity | 13.01% | 16.33% | -2.77% |
| Return on Assets | 0.85% | 1.18% | -0.19% |
| Net Margin | 14.22% | 26.06% | -9.37% |
| EBIT Margin | 42.36% | 66.33% | 24.18% |
| EBITDA Margin | 42.36% | 66.33% | 24.18% |
| Gross Margin | 17.75% | 33.94% | 36.06% |
| R&D to Revenue | 0% | 0% | 0% |
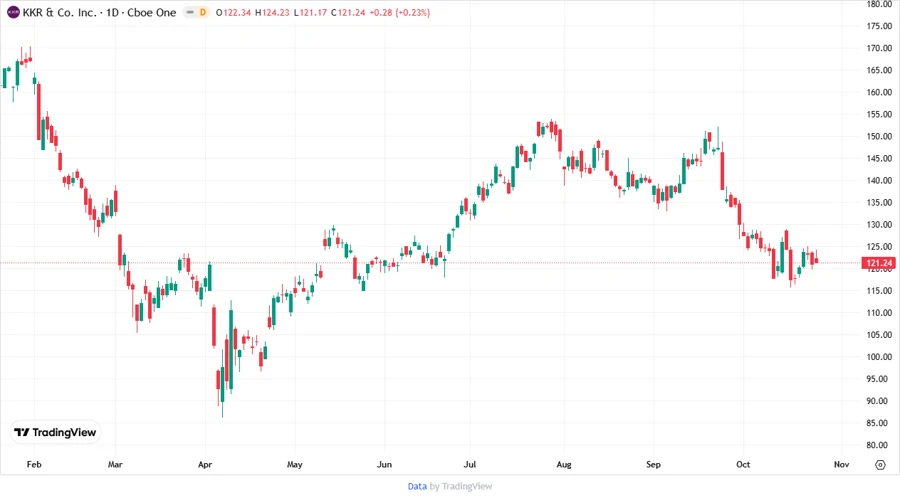
Price Development
Dividend Scoring System
📊 This section evaluates KKR's dividend profile using various performance metrics. Each category carries different weights to establish a comprehensive view of dividend quality and dependability.
| Criteria | Score (1-5) | Score |
|---|---|---|
| Dividend Yield | 2 | |
| Dividend Stability | 5 | |
| Dividend Growth | 3 | |
| Payout Ratio | 5 | |
| Financial Stability | 4 | |
| Dividend Continuity | 5 | |
| Cashflow Coverage | 3 | |
| Balance Sheet Quality | 3 |
Total Score: 30/40
Rating
✅ Overall, KKR & Co. Inc. provides a solid dividend profile with robust stability and a longstanding payment history. Suitable for conservative investors, it offers moderate growth potential amidst a fundamentally sound framework. However, the modest yield might necessitate consideration of other income-focused investment alternatives for more aggressive dividend seekers.
Smart Data Insight
Master the Perfect Entry & Exit for this Stock
Don't leave your profits to chance. Historically, this stock follows specific seasonal patterns that institutional traders use to maximize returns.
- ✅ Identify the "Golden Buying Window"
- ✅ Avoid high-risk correction cycles
- ✅ Backtested data from the last 20+ years