September 09, 2025 a 02:47 am


KKR: Dividend Analysis - KKR & Co. Inc.
KKR & Co. Inc., a prominent name in investment finance, showcases an extensive dividend history with a promising outlook for investors seeking stable yet moderate returns. Its robust financial structure, reflected in a healthy dividend yield and reliable growth, makes it a noteworthy consideration for long-term dividend-focused portfolios. Despite certain fluctuations in broader market stability, KKR remains committed to upholding shareholder value through consistent dividend policies.
📊 Overview
KKR operates in the Financial Services sector, rendering it susceptible to market fluctuations but also offering growth opportunities due to financial innovations. KKR provides its investors with a viable dividend yield of 0.51%, complemented by a solid track record of 16 years in uninterrupted dividend history, indicating its resilience and commitment to rewarding shareholders.
| Metric | Value |
|---|---|
| Sector | Financial Services |
| Dividend Yield | 0.51% |
| Current Dividend per Share | 0.69 USD |
| Dividend History | 16 years |
| Last Cut or Suspension | None |
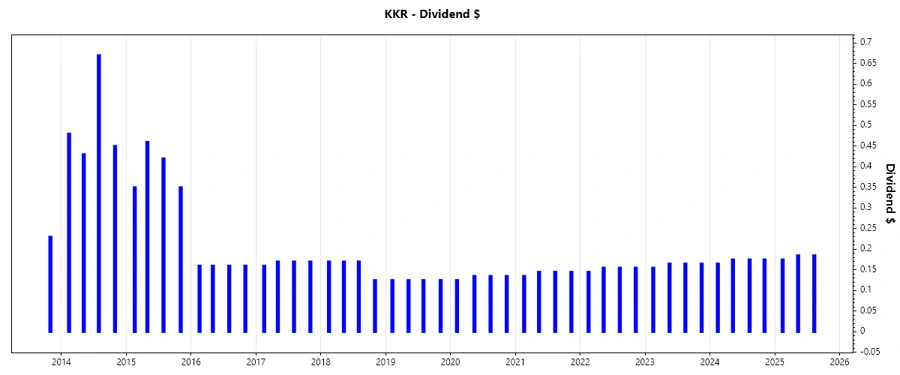
🗣️ Dividend History
The consistency of KKR’s dividend history is indicative of its operational stability and governance integrity. For investors, a long-standing history of dividend payments assures continuous income, which is essential for portfolio longevity, especially in turbulent market environments.
| Year | Dividend per Share (USD) |
|---|---|
| 2025 | 0.545 |
| 2024 | 0.69 |
| 2023 | 0.65 |
| 2022 | 0.61 |
| 2021 | 0.57 |
📈 Dividend Growth
Examining dividend growth is crucial for forecasting potential future payouts. The analysis of growth rates offers insights into a company's financial health and its ability to increase shareholder returns consistently.
| Time | Growth |
|---|---|
| 3 years | 6.58% |
| 5 years | 6.65% |
The average dividend growth is 6.65% over 5 years. This shows moderate but steady dividend growth, indicative of the company’s focus on incremental shareholder value addition.
✅ Payout Ratio
A disciplined payout ratio reflects a company's strategic financial decisions, providing insights into its dividend sustainability. A balanced ratio suggests good retention of earnings for growth while rewarding investors.
| Key Figure | Ratio |
|---|---|
| EPS-based | 29.98% |
| Free cash flow-based | 13.46% |
The EPS-based payout ratio of 29.98% and FCF payout at 13.46% indicate responsible financial management, ensuring dividend commitments are met without compromising company growth prospects.
📉 Cashflow & Capital Efficiency
Cash flow analysis and capital efficiency provide insight into a firm's operational efficacy and its potential to sustain strategic investments and shareholder returns over time.
| Metric | 2024 | 2023 | 2022 |
|---|---|---|---|
| Free Cash Flow Yield | 4.96% | -2.23% | -15.42% |
| Earnings Yield | 2.34% | 5.19% | -1.50% |
| CAPEX to Operating Cash Flow | 2.13% | -7.26% | -1.61% |
| Stock-based Compensation to Revenue | 3.45% | 4.32% | 13.12% |
| Free Cash Flow / Operating Cash Flow Ratio | 97.87% | 107.26% | 101.61% |
Despite varying yields across years, KKR's cash flow ratios indicate robust capital efficiency and a structured approach towards productive investments, crucial for enhancing shareholder returns.
🏦 Balance Sheet & Leverage Analysis
A comprehensive view of a company’s balance sheet and its leverage profile highlights its financial stability, liquidity conditions, and debt-handling capacity, providing risk assessment insights.
| Metric | 2024 | 2023 | 2022 |
|---|---|---|---|
| Debt-to-Equity | 2.15 | 2.16 | 2.34 |
| Debt-to-Assets | 0.14 | 0.16 | 0.16 |
| Debt-to-Capital | 0.68 | 0.68 | 0.70 |
| Net Debt to EBITDA | 3.92 | 3.06 | 23.22 |
| Current Ratio | 4.12 | 4.71 | 1.49 |
| Quick Ratio | 4.12 | 4.71 | 1.49 |
| Financial Leverage | 15.22 | 13.88 | 14.64 |
KKR's leverage metrics suggest a strategically managed debt profile. While high debt levels may raise concerns, the company's substantial asset liquidity provides adequate coverage and financial stability.
🔍 Fundamental Strength & Profitability
Profitability ratios and fundamental strength analyses serve as key indicators of a firm's operational efficiency, ability to generate profit, and overall financial health.
| Metric | 2024 | 2023 | 2022 |
|---|---|---|---|
| Return on Equity | 13.01% | 16.33% | -2.77% |
| Return on Assets | 0.85% | 1.18% | -0.19% |
| Margins: Net | 14.22% | 26.05% | -9.37% |
| Margins: EBIT | 42.36% | 66.33% | 24.18% |
| Margins: EBITDA | 42.36% | 66.33% | 24.18% |
| Margins: Gross | 17.75% | 33.94% | 36.06% |
| Research & Development to Revenue | 0% | 0% | 0% |
Despite some fluctuation in profitability margins over time, KKR demonstrates strategic management leveraging its assets efficiently to sustain profitability and operational control, crucial for long-term growth.
💰 Price Development
📊 Dividend Scoring System
| Criterion | Score | Score Bar |
|---|---|---|
| Dividend yield | 3/5 | |
| Dividend Stability | 4/5 | |
| Dividend growth | 4/5 | |
| Payout ratio | 5/5 | |
| Financial stability | 3/5 | |
| Dividend continuity | 5/5 | |
| Cashflow Coverage | 3/5 | |
| Balance Sheet Quality | 3/5 |
Total Score: 30/40
🗣️ Rating
Overall, KKR & Co. Inc. presents itself as a reliable option for dividend investors, boasting a well-maintained track record and moderate growth prospects. The firm strikes a reasonable balance between providing returns to its shareholders and reinvesting in its growth. While certain cash flow variances warrant monitoring, its established dividend history and payout consistency offer confidence for medium to long-term investment horizons. We recommend KKR as a 'Buy' for dividend-focused portfolios. 🏆
Smart Data Insight
Master the Perfect Entry & Exit for this Stock
Don't leave your profits to chance. Historically, this stock follows specific seasonal patterns that institutional traders use to maximize returns.
- ✅ Identify the "Golden Buying Window"
- ✅ Avoid high-risk correction cycles
- ✅ Backtested data from the last 20+ years