KEYS: Fundamental Ratio Analysis - Keysight Technologies Inc
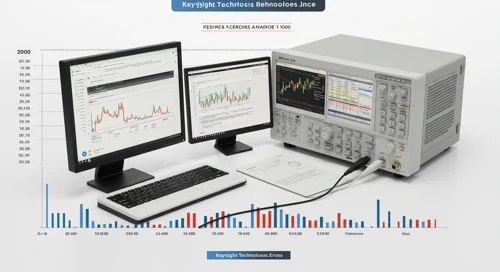
KEYS: Evaluation of key financial ratios, analyst ratings, and price targets. A data-driven perspective on the valuation and market expectations.
May 28, 2026 a 06:00 pm
CTSH: Analysts Ratings - Cognizant Technology Solutions Corporation

CTSH: Comprehensive breakdown of current and historical analyst ratings, offering insights into how expert sentiment has evolved over time.
May 28, 2026 a 05:00 pm
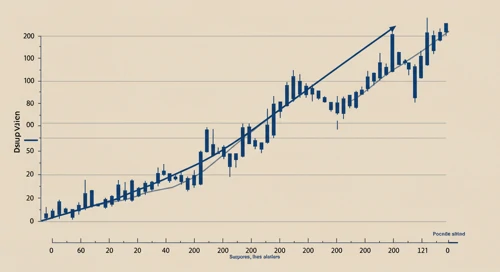
FRT: Fibunacci Level Technical Analysis - Federal Realty Investment Trust
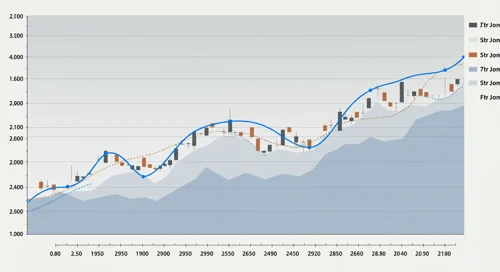
FRT: Fibonacci retracement levels to identify key potential support and resistance zones, based on recent price trends.
May 28, 2026 a 04:44 pm
ERIE: Analysts Ratings - Erie Indemnity Company

ERIE: Comprehensive breakdown of current and historical analyst ratings, offering insights into how expert sentiment has evolved over time.
May 28, 2026 a 04:38 pm
CRM: Fundamental Ratio Analysis - Salesforce Inc

CRM: Evaluation of key financial ratios, analyst ratings, and price targets. A data-driven perspective on the valuation and market expectations.
May 28, 2026 a 03:43 pm
LH: Dividend Analysis - Labcorp Holdings Inc

LH: In-depth analysis of a company's dividend stability and key fundamental ratios to assess its financial strength and long-term investment potential.
May 28, 2026 a 03:31 pm
MSCI: Fibunacci Level Technical Analysis - MSCI Inc
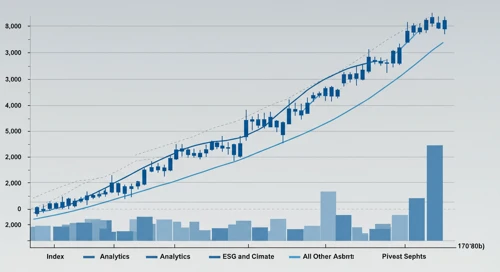
MSCI: Fibonacci retracement levels to identify key potential support and resistance zones, based on recent price trends.
May 28, 2026 a 03:15 pm
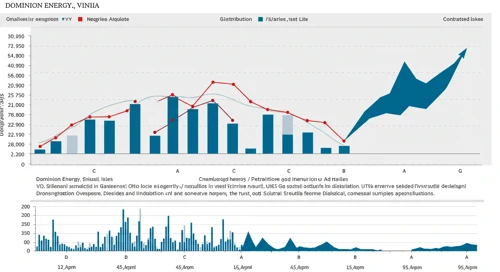
D: Analysts Ratings - Dominion Energy Inc
May 28, 2026 a 09:00 pm

ORCL: Analysts Ratings - Oracle Corporation
May 28, 2026 a 08:38 pm
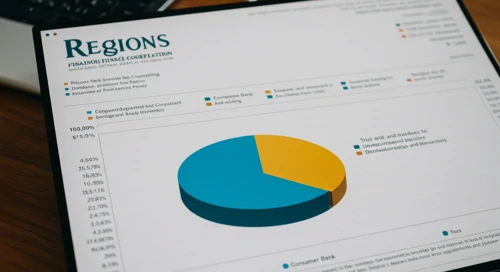
RF: Fundamental Ratio Analysis - Regions Financial Corporation
May 28, 2026 a 07:43 pm
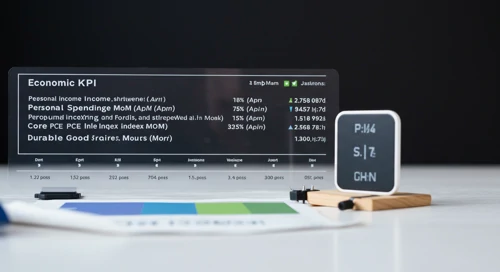
Todays Important Key Figures 28 May
May 28, 2026 a 07:00 pm
Financials Comparison. 28 May
Comparison of Financials. Where is strength and weakness? What has developed well and badly?
May 28, 2026 a 03:12 pm
AJG: Trend with Support and Resistance Levels - Arthur J Gallagher and Co
AJG: Current price trend is evaluated alongside key support and resistance level. View of potential turning points and price momentum.
May 28, 2026 a 02:03 pm
LOW: Trend with Support and Resistance Levels - Lowes Companies Inc
LOW: Current price trend is evaluated alongside key support and resistance level. View of potential turning points and price momentum.
May 28, 2026 a 01:15 pm
TYL: Analysts Ratings - Tyler Technologies Inc
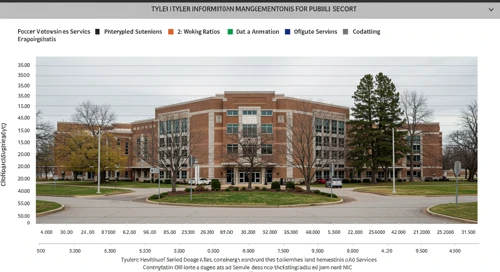
TYL: Comprehensive breakdown of current and historical analyst ratings, offering insights into how expert sentiment has evolved over time.
May 28, 2026 a 01:00 pm
CHD: Fundamental Ratio Analysis - Church and Dwight Co Inc
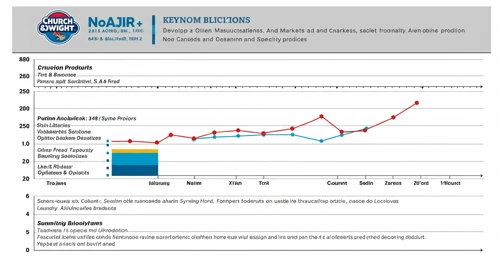
CHD: Evaluation of key financial ratios, analyst ratings, and price targets. A data-driven perspective on the valuation and market expectations.
May 28, 2026 a 01:00 pm
CPT: Dividend Analysis - Camden Property Trust

CPT: In-depth analysis of a company's dividend stability and key fundamental ratios to assess its financial strength and long-term investment potential.
May 28, 2026 a 12:46 pm
VLTO: Analysts Ratings - Veralto Corporation
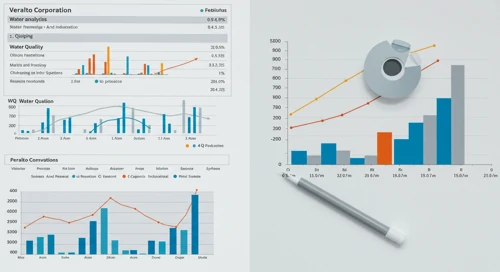
VLTO: Comprehensive breakdown of current and historical analyst ratings, offering insights into how expert sentiment has evolved over time.
May 28, 2026 a 12:38 pm
Stock Market - Heatmap
Use mouse wheel to zoom in and out. Click a ticker to display detailed information in a new window. Hover mouse cursor over a ticker to see more data.
Stock's
PNR: Trend with Support and Resistance Levels - Pentair plc
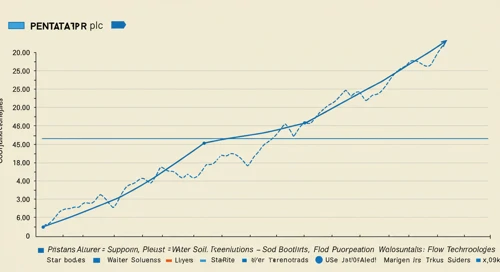
PNR: Current price trend is evaluated alongside key support and resistance level. View of potential turning points and price momentum.
May 28, 2026 a 09:03 am
RVTY: Analysts Ratings - Revvity Inc

RVTY: Comprehensive breakdown of current and historical analyst ratings, offering insights into how expert sentiment has evolved over time.
May 28, 2026 a 09:00 am
HIG: Analysts Ratings - The Hartford Financial Services Group Inc
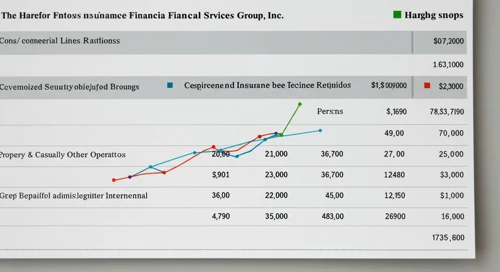
HIG: Comprehensive breakdown of current and historical analyst ratings, offering insights into how expert sentiment has evolved over time.
May 28, 2026 a 08:38 am
ABBV: Trend with Support and Resistance Levels - AbbVie Inc
ABBV: Current price trend is evaluated alongside key support and resistance level. View of potential turning points and price momentum.
May 28, 2026 a 08:15 am
DTE: Fundamental Ratio Analysis - DTE Energy Company
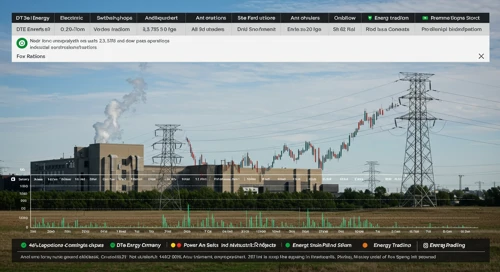
DTE: Evaluation of key financial ratios, analyst ratings, and price targets. A data-driven perspective on the valuation and market expectations.
May 28, 2026 a 08:00 am
AMCR: Dividend Analysis - Amcor plc
AMCR: In-depth analysis of a company's dividend stability and key fundamental ratios to assess its financial strength and long-term investment potential.
May 28, 2026 a 07:46 am
CINF: Fundamental Ratio Analysis - Cincinnati Financial Corporation
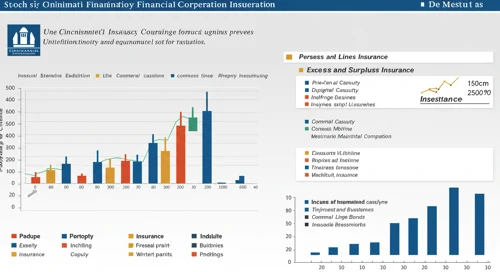
CINF: Evaluation of key financial ratios, analyst ratings, and price targets. A data-driven perspective on the valuation and market expectations.
May 28, 2026 a 07:43 am
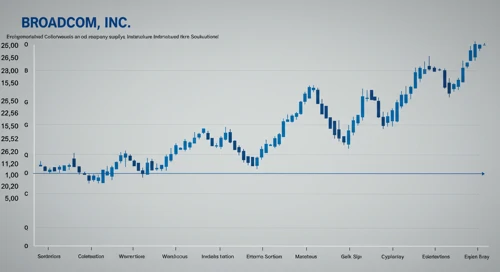
AVGO: Fibunacci Level Technical Analysis - Broadcom Inc
May 28, 2026 a 11:44 am
CNP: Fundamental Ratio Analysis - CenterPoint Energy Inc
May 28, 2026 a 11:43 am
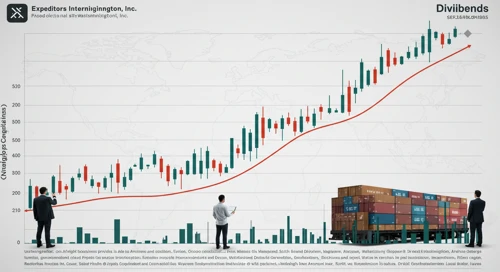
EXPD: Dividend Analysis - Expeditors International of Washington Inc
May 28, 2026 a 11:31 am
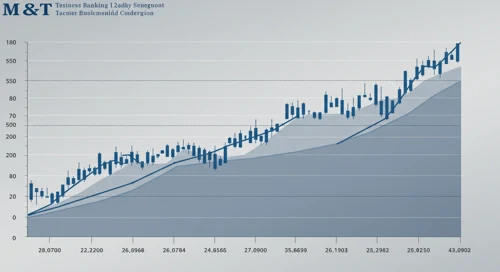
MTB: Fibunacci Level Technical Analysis - MandT Bank Corporation
May 28, 2026 a 10:15 am
ROL: Dividend Analysis - Rollins Inc

ROL: In-depth analysis of a company's dividend stability and key fundamental ratios to assess its financial strength and long-term investment potential.
May 28, 2026 a 07:31 am
AME: Fibunacci Level Technical Analysis - AMETEK Inc
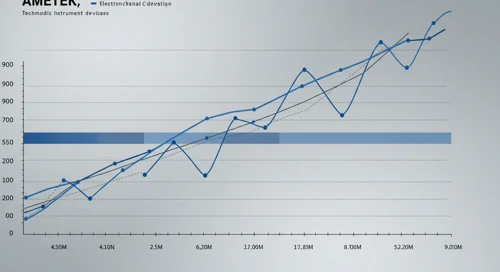
AME: Fibonacci retracement levels to identify key potential support and resistance zones, based on recent price trends.
May 28, 2026 a 06:44 am
HII: Fibunacci Level Technical Analysis - Huntington Ingalls Industries Inc
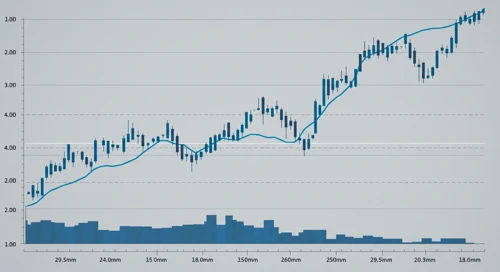
HII: Fibonacci retracement levels to identify key potential support and resistance zones, based on recent price trends.
May 28, 2026 a 05:15 am
SBUX: Trend with Support and Resistance Levels - Starbucks Corporation
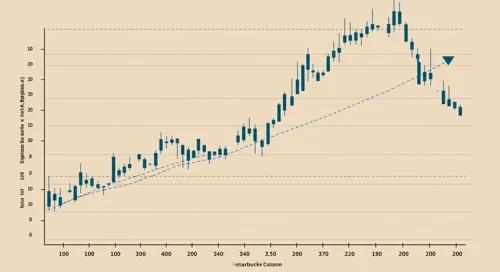
SBUX: Current price trend is evaluated alongside key support and resistance level. View of potential turning points and price momentum.
May 28, 2026 a 04:03 am
PAYX: Dividend Analysis - Paychex Inc

PAYX: In-depth analysis of a company's dividend stability and key fundamental ratios to assess its financial strength and long-term investment potential.
May 28, 2026 a 03:31 am
NWSA: Trend with Support and Resistance Levels - News Corporation
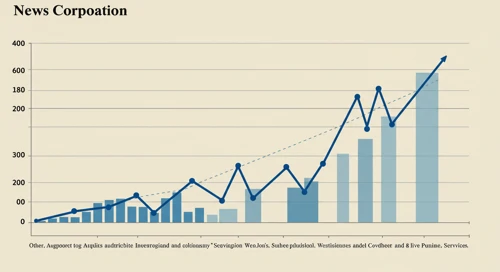
NWSA: Current price trend is evaluated alongside key support and resistance level. View of potential turning points and price momentum.
May 28, 2026 a 03:15 am
PM: Dividend Analysis - Philip Morris International Inc
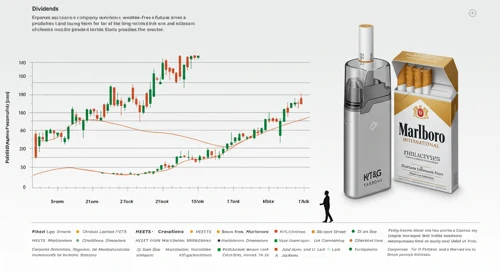
PM: In-depth analysis of a company's dividend stability and key fundamental ratios to assess its financial strength and long-term investment potential.
May 28, 2026 a 02:46 am
Economic Calendar
Currencies
GBPAUD: Fibunacci Level Technical Analysis
GBPAUD: Fibonacci retracement levels to identify key potential support and resistance zones, based on recent price trends.
May 27, 2026 a 05:08 am
EURJPY: Trend with Support and Resistance Levels
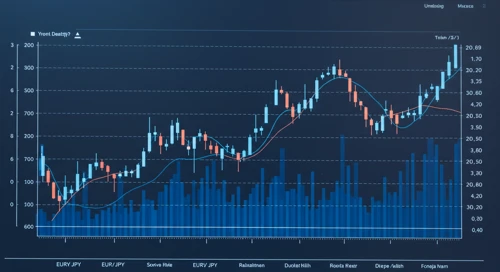
EURJPY: Current price trend is evaluated alongside key support and resistance level. View of potential turning points and price momentum.
May 27, 2026 a 04:28 am
Todays Important Key Figures 26 May

Today’s important economic data releases – a snapshot of key indicators influencing markets and shaping financial expectations.
May 26, 2026 a 07:00 pm
CADJPY: Fibunacci Level Technical Analysis
CADJPY: Fibonacci retracement levels to identify key potential support and resistance zones, based on recent price trends.
May 26, 2026 a 05:08 am
EURGBP: Trend with Support and Resistance Levels
EURGBP: Current price trend is evaluated alongside key support and resistance level. View of potential turning points and price momentum.
May 26, 2026 a 04:28 am
Important Key Figures of the last Days

Overview of key economic indicators released over the past days, highlighting their potential impact on markets and investor sentiment.
May 26, 2026 a 02:31 am
Todays Important Key Figures 25 May

Today’s important economic data releases – a snapshot of key indicators influencing markets and shaping financial expectations.
May 25, 2026 a 07:00 pm
AUDUSD: Fibunacci Level Technical Analysis
May 28, 2026 a 05:08 am
USDCHF: Trend with Support and Resistance Levels
May 28, 2026 a 04:28 am
Important Key Figures of the last Days
May 28, 2026 a 02:31 am

Todays Important Key Figures 27 May
May 27, 2026 a 07:00 pm
GBPUSD: Fibunacci Level Technical Analysis
GBPUSD: Fibonacci retracement levels to identify key potential support and resistance zones, based on recent price trends.
May 25, 2026 a 05:08 am
GBPJPY: Trend with Support and Resistance Levels
GBPJPY: Current price trend is evaluated alongside key support and resistance level. View of potential turning points and price momentum.
May 25, 2026 a 04:28 am
GBPCAD: Fibunacci Level Technical Analysis
GBPCAD: Fibonacci retracement levels to identify key potential support and resistance zones, based on recent price trends.
May 24, 2026 a 05:08 am
NZDCAD: Trend with Support and Resistance Levels
NZDCAD: Current price trend is evaluated alongside key support and resistance level. View of potential turning points and price momentum.
May 24, 2026 a 04:28 am
AUDNZD: Fibunacci Level Technical Analysis
AUDNZD: Fibonacci retracement levels to identify key potential support and resistance zones, based on recent price trends.
May 23, 2026 a 05:08 am
Todays Important Key Figures 23 May

Today’s important economic data releases – a snapshot of key indicators influencing markets and shaping financial expectations.
May 22, 2026 a 11:00 pm
Todays Important Key Figures 22 May

Today’s important economic data releases – a snapshot of key indicators influencing markets and shaping financial expectations.
May 22, 2026 a 07:00 pm
Currencies