August 10, 2025 a 03:15 am

KIM: Trend and Support & Resistance Analysis - Kimco Realty Corporation
Kimco Realty Corporation has experienced fluctuations in its stock price over the past months. As one of North America's significant owners of grocery-anchored shopping centers, the company's financial health is crucial for investors seeking stable returns. With ongoing market dynamics, it's essential to understand the technical trends and potential support and resistance zones for strategy formulation.
Trend Analysis
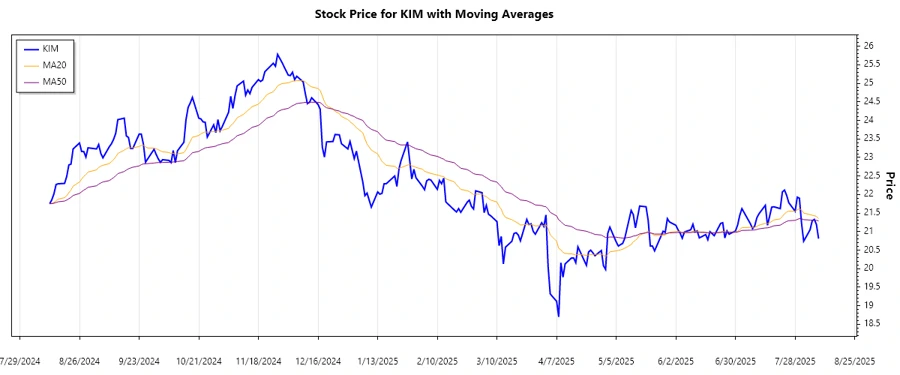
The analysis of Kimco Realty's daily closing prices reveals the current market dynamics. The computed EMAs provide insight into the trend lines:
| Date | Closing Price | Trend |
|---|---|---|
| 2025-08-08 | 20.81 | ▼ |
| 2025-08-07 | 21.19 | ▼ |
| 2025-08-06 | 21.33 | ▼ |
| 2025-08-05 | 21.29 | ▼ |
| 2025-08-04 | 21.05 | ▼ |
| 2025-08-01 | 20.74 | ▼ |
| 2025-07-31 | 21.23 | ▼ |
The computed EMA20 and EMA50 lines suggest a bearish trend (EMA20 < EMA50) over this period. This indicates potential declines, emphasizing a vigilant approach in monitoring the stock.
Support and Resistance
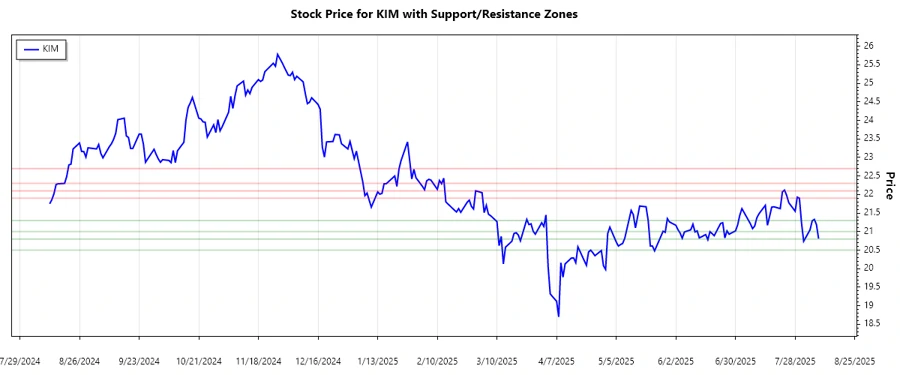
Key support and resistance levels have been identified based on historical price action:
| Zone | From | To |
|---|---|---|
| Support Zone 1 | 20.5 | 20.8 |
| Support Zone 2 | 21.0 | 21.3 |
| Resistance Zone 1 | 21.9 | 22.1 |
| Resistance Zone 2 | 22.3 | 22.7 |
The current price level positions in a critical support zone. Monitoring for breakout or reversal signals is essential, which could dictate the next movement in stock trajectory.
Conclusion
Kimco Realty's stock is presenting a bearish trend, according to the calculated EMAs. While its fundamental strengths in the real estate market are notable, current technical indicators imply caution for short-term investors. Observing significant support zones is crucial for anticipating potential rebounds. For risk-averse investors, waiting for a clearer trend signal or a breakout might be prudent. However, those with a long-term perspective might find current levels attractive for accumulating positions.
Smart Data Insight
Master the Perfect Entry & Exit for this Stock
Don't leave your profits to chance. Historically, this stock follows specific seasonal patterns that institutional traders use to maximize returns.
- ✅ Identify the "Golden Buying Window"
- ✅ Avoid high-risk correction cycles
- ✅ Backtested data from the last 20+ years