May 15, 2026 a 01:00 pm

KIM: Fundamental Ratio Analysis - Kimco Realty Corporation
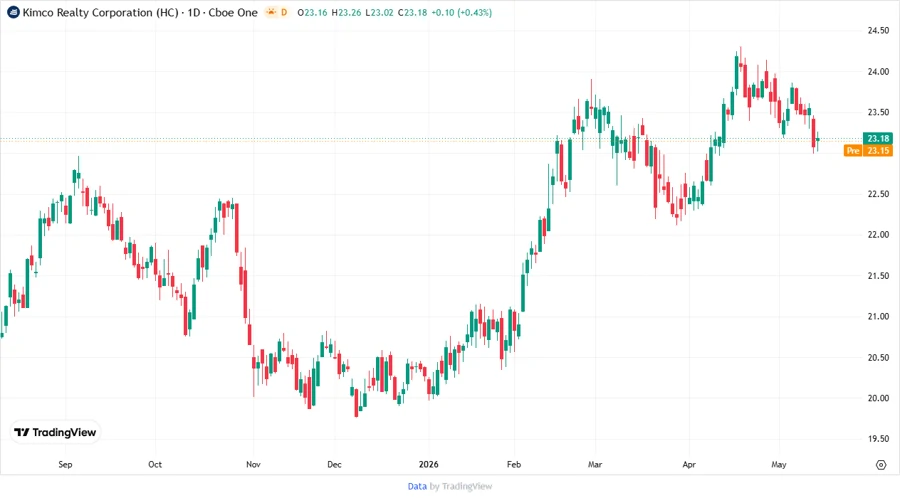
Kimco Realty Corporation (NYSE: KIM) is a significant player in the real estate sector, specializing in open-air, grocery-anchored shopping centers. Listed since 1991 and included in the S&P 500, the company holds a robust portfolio and continues to show potential for growth with a strategic focus on prime metropolitan markets. However, as with many REITs, market volatility can impact short-term performance.
Fundamentals Rating
The current fundamental analysis of Kimco Realty Corporation suggests a solid but cautious B rating. Let's break down the metrics that contribute to this score.
| Category | Score | Visualization |
|---|---|---|
| Discounted Cash Flow | 4 | |
| Return On Equity | 3 | |
| Return On Assets | 4 | |
| Debt To Equity | 2 | |
| Price To Earnings | 2 | |
| Price To Book | 2 |
Historical Rating
Analyzing historical scores can provide a perspective on the company’s performance over time.
| Date | Overall | DCF | ROE | ROA | D-to-E | P/E | P/B |
|---|---|---|---|---|---|---|---|
| Current (2026-05-14) | 3 | 4 | 3 | 4 | 2 | 2 | 2 |
| Previous | 0 | 4 | 3 | 4 | 2 | 2 | 2 |
Analyst Price Targets
Here's a look at analyst expectations for Kimco Realty Corporation's future price performance.
| High | Low | Median | Consensus |
|---|---|---|---|
| $28 | $21 | $25 | $24.58 |
Analyst Sentiment
Analyst recommendations provide a window into market sentiment.
| Recommendation | Count | Percentage |
|---|---|---|
| Strong Buy | 1 | |
| Buy | 12 | |
| Hold | 23 | |
| Sell | 0 | |
| Strong Sell | 0 |
Conclusion
Kimco Realty Corporation exhibits solid fundamentals, with strong performance metrics in areas like DCF and ROA, but struggles with debt management and price multiples. Analyst sentiments indicate a general consensus towards holding the stock, with some optimism reflected in the high price target projections. Given the current economic climate, investors should weigh both potential growth opportunities and inherent risks, particularly within the volatile retail REIT sector. Diversified exposure to prime markets and strategic expansion initiatives could support future resilience and performance.
Smart Data Insight
Master the Perfect Entry & Exit for this Stock
Don't leave your profits to chance. Historically, this stock follows specific seasonal patterns that institutional traders use to maximize returns.
- ✅ Identify the "Golden Buying Window"
- ✅ Avoid high-risk correction cycles
- ✅ Backtested data from the last 20+ years