January 26, 2026 a 10:15 am

KIM: Fibonacci Analysis - Kimco Realty Corporation
Kimco Realty Corporation's stock has exhibited notable price movements over recent months, reflecting its dynamic positioning within the real estate investment trust sector. The analysis will consider recent trends to evaluate potential future directions. Through Fibonacci retracement, key price levels will be identified, offering insights into possible support and resistance zones for traders and investors.
Fibonacci Analysis
| Detail | Data |
|---|---|
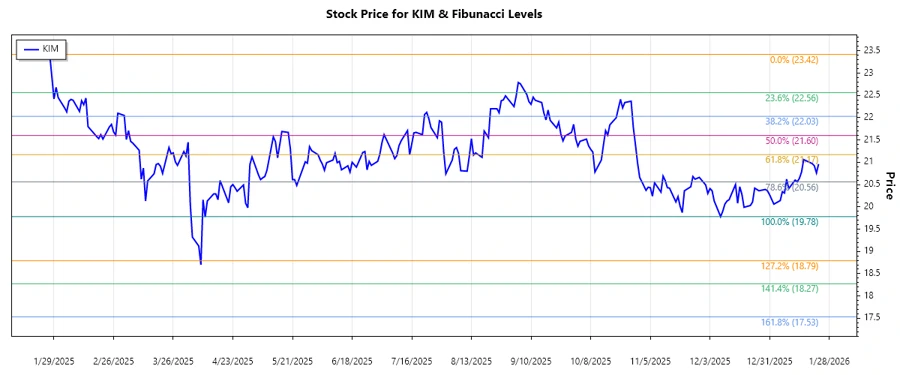
| Trend Start Date | 2025-01-27 |
| Trend End Date | 2026-01-23 |
| High Point (Price & Date) | $23.42 on 2025-01-27 |
| Low Point (Price & Date) | $19.78 on 2025-12-08 |
| Fibonacci Level | Price Level ($) |
|---|---|
| 0.236 | $20.74 |
| 0.382 | $21.54 |
| 0.5 | $21.96 |
| 0.618 | $22.38 |
| 0.786 | $22.90 |
The current price of KIM at $20.96 is within the 0.236 retracement level, suggesting it may act as a support level. This level is critical as it could indicate potential buying interest that might lead to price recovery.
Conclusion
Kimco Realty Corporation's stock shows potential for gaining momentum with identified Fibonacci retracement levels providing key insights. While the stock currently rests near the 0.236 level, careful monitoring is advised to see if it holds as a support or if it breaks lower. The identified levels may also serve as resistance if the price ascends, posing potential challenges in the short term. Analysts should consider external economic factors influencing the real estate market as these could impact price dynamics further.