August 22, 2025 a 05:15 am
KIM: Fibonacci Analysis - Kimco Realty Corporation
Kimco Realty Corporation (NYSE:KIM) has been a solid player in the real estate investment trust sector, focusing predominantly on open-air, grocery-anchored shopping centers. Despite market fluctuations, the company has displayed resilience with its widespread U.S. footprint. Over the past months, the stock has experienced fluctuations leading to potential retracement areas. Investors should monitor key technical levels as the current market sentiment could influence future price movements.
Fibonacci Analysis
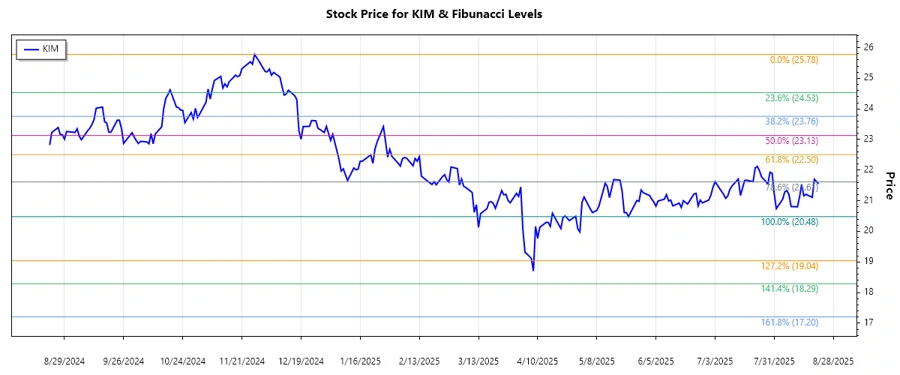
In our recent analysis of KIM, we have identified a dominant downward trend spanning several months. Utilizing the high of $25.78 on November 27, 2024, and the low of $20.48 on May 23, 2025, we have calculated the Fibonacci retracement levels which are critical for identifying potential reversal zones or continued decline.
| Description | Value |
|---|---|
| Trend Start Date | 2024-11-27 |
| Trend End Date | 2025-05-23 |
| High Price | $25.78 |
| Low Price | $20.48 |
Fibonacci Retracement Levels:
| Level | Price |
|---|---|
| 0.236 | $22.57 |
| 0.382 | $23.40 |
| 0.500 | $23.95 |
| 0.618 | $24.51 |
| 0.786 | $25.23 |
As of the latest price point of $21.55 on August 21, 2025, the stock is outside any significant Fibonacci retracement zone.
This indicates that the price may encounter resistance if it attempts to climb back to higher retracement levels, potentially presenting a challenge in reversing the downward trend.
Conclusion
Kimco Realty Corporation shows potential, despite the ongoing downward trend. While the downward momentum prevails, the calculated Fibonacci levels serve as crucial junctures to watch for potential reversals or continued declines. Analysts should remain cautious, as external market pressures and sector-specific changes may impact recovery potential. Investors should consider balances between risk tolerance and potential recovery in their decision-making. A rebound from current levels could indicate renewed investor interest, whereas failure to hold above key retracement zones may signal further downside pressure.
Smart Data Insight
Master the Perfect Entry & Exit for this Stock
Don't leave your profits to chance. Historically, this stock follows specific seasonal patterns that institutional traders use to maximize returns.
- ✅ Identify the "Golden Buying Window"
- ✅ Avoid high-risk correction cycles
- ✅ Backtested data from the last 20+ years