
June 26, 2026 a 07:31 am

KIM: Dividend Analysis - Kimco Realty Corporation
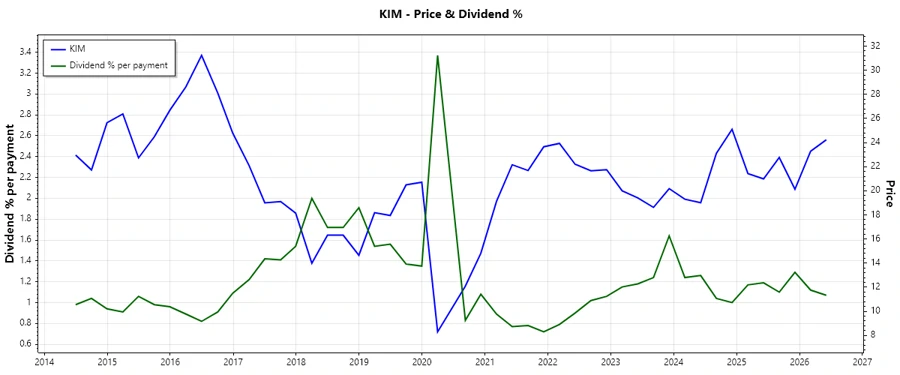
Kimco Realty Corporation, a prominent player in the real estate sector, is a leading and influential figure with extensive dividend history spanning 35 years. The company's impressive dividend yield of 4.25% combined with consistent annual payouts makes it a remarkable choice for income-focused investors. While the high EPS payout ratio highlights a need for careful monitoring, Kimco's resilient performance in dividend growth and financial stability reaffirms its potential as a reliable dividend stock for long-term portfolios.
📊 Overview
| Attribute | Value |
|---|---|
| Sector | Real Estate |
| Dividend yield | 4.25% |
| Current dividend per share | $1.06 |
| Dividend history | 35 years |
| Last cut or suspension | None |
🗣️ Dividend History
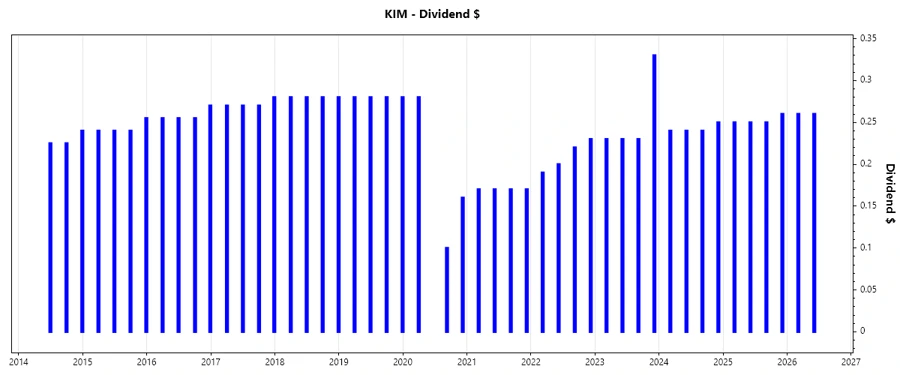
The company's extensive history of 35 years without a significant cut or suspension underscores the robustness and dependability of their dividend payments. Investors can find assurance in such a track record, particularly those seeking passive income. Understanding past performance facilitates better future expectations.
| Year | Dividend per Share (USD) |
|---|---|
| 2026 | 0.52 |
| 2025 | 1.01 |
| 2024 | 0.97 |
| 2023 | 1.02 |
| 2022 | 0.84 |
📈 Dividend Growth
Kimco Realty's dividend growth over three and five years offers insights into its commitment towards shareholder returns, boasting modest growth reflective of steady cash flow management. Evaluating recent growth alongside historical data provides investors a comprehensive view of its dividend sustainability.
| Time | Growth |
|---|---|
| 3 years | 6.33% |
| 5 years | 13.34% |
The average dividend growth is 13.34% over 5 years. This shows moderate but steady dividend growth, indicating strong financial stewardship and commitment to rewarding shareholders.
📉 Payout Ratio
Analyzing payout ratios serves as an essential barometer of financial health, particularly the EPS-based ratio which is currently over 115%, suggesting potential constraints on future dividend increases without affecting retained earnings or requiring external funding. On a more optimistic note, the FCF payout ratio at approximately 85% demonstrates an ample cushion supported by cash flow strength.
| Key figure | Ratio |
|---|---|
| EPS-based | 115.61% |
| Free cash flow-based | 84.76% |
High EPS payout ratio indicates limited room for further dividend hikes. The cash flow-based ratio suggests dividends are comfortably covered by operations, essential for sustainability.
🗂️ Cashflow & Capital Efficiency
Examining cash flow and capital use efficiency metrics provides critical insights into operational performance and strategic allocation of resources, highlighting potential areas for improving financial flexibility or prioritizing shareholder returns.
| Metric | 2023 | 2024 | 2025 |
|---|---|---|---|
| Free Cash Flow Yield | 6.14% | 4.33% | 5.65% |
| Earnings Yield | 4.98% | 2.61% | 4.28% |
| CAPEX to Operating Cash Flow | 24.67% | 32.27% | 31.04% |
| Stock-based Compensation to Revenue | 1.85% | 1.71% | 0% |
| Free Cash Flow / Operating Cash Flow Ratio | 75.33% | 67.73% | 68.96% |
The data suggest consistent operational liquidity but underscore the need for effective capital reinvestment strategies, optimizing capital use to enhance future yield transitions.
📉 Balance Sheet & Leverage Analysis
Understanding balance sheet dynamics and leverage informs decisions related to financial solvency, debt structuring and potential borrowing capacities critical in identifying potential risks or merits of existing capital strategies.
| Metric | 2023 | 2024 | 2025 |
|---|---|---|---|
| Debt-to-Equity | 83.15% | 80.53% | 83.15% |
| Debt-to-Assets | 42.28% | 42.23% | 43.89% |
| Debt-to-Capital | 44.79% | 44.61% | 45.40% |
| Net Debt to EBITDA | 4.96x | 6.25x | 5.19x |
| Current Ratio | 6.42 | 3.58 | 1.08 |
| Quick Ratio | 6.42 | 3.58 | 1.08 |
| Financial Leverage | 1.92 | 1.91 | 1.89 |
Motivating factors in current ratios bolster liquidity positions while balancing fiscal leverage ensures agile debt management aligned with strategic debt reductions.
🔍 Fundamental Strength & Profitability
Comprehending core profitability metrics and return ratios reflects the aptitude of generating earnings from core activities, critical to maintaining intrinsic value assessed over market valuations.
| Metric | 2023 | 2024 | 2025 |
|---|---|---|---|
| Return on Equity | 6.87% | 3.86% | 5.62% |
| Return on Assets | 3.58% | 2.02% | 2.97% |
| Margins: Net | 36.69% | 20.17% | 27.29% |
| EBIT | 50.14% | 32.35% | 46.87% |
| EBITDA | 78.57% | 61.99% | 75.83% |
| Gross | 68.78% | 68.70% | 54.66% |
| Research & Development to Revenue | 0% | 0% | 0% |
Surging profitability ratios alongside robust operating margins are indicative of effective resource allocation, underscoring the potential for growth in earnings quality and enhancing capital returns.
📈 Price Development
📊 Dividend Scoring System
| Criteria | Score (1-5) | |
|---|---|---|
| Dividend yield | 4 | |
| Dividend Stability | 5 | |
| Dividend Growth | 4 | |
| Payout ratio | 3 | |
| Financial stability | 4 | |
| Dividend continuity | 5 | |
| Cashflow Coverage | 3 | |
| Balance Sheet Quality | 4 |
Total Score: 32/40
✅ Rating
Kimco Realty Corporation shows strong potential as a stable income source within diversified portfolios. The overall scoring system reveals a robust dividend yield, formidable dividend history, and solid growth metrics supporting the case for inclusion as a reliable income-generating asset. Nevertheless, diverse financial indicators necessitate vigilant monitoring for any potential financial turbulence or economic shocks that may impact future payouts. Investors should consider aligning such investments within a comprehensive strategy governing both risks and returns for optimal deployment of capital across income-focused portfolios.
Smart Data Insight
Master the Perfect Entry & Exit for this Stock
Don't leave your profits to chance. Historically, this stock follows specific seasonal patterns that institutional traders use to maximize returns.
- ✅ Identify the "Golden Buying Window"
- ✅ Avoid high-risk correction cycles
- ✅ Backtested data from the last 20+ years