
May 30, 2026 a 02:46 am
KIM: Dividend Analysis - Kimco Realty Corporation
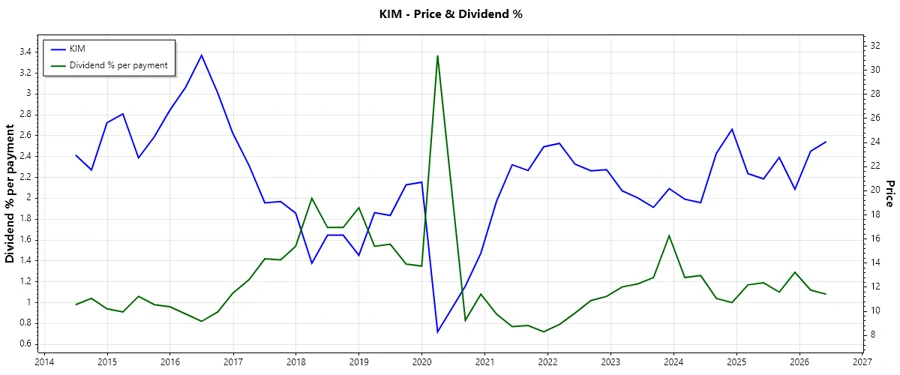
Kimco Realty Corporation is a prominent player in the real estate sector, showcasing a strong commitment to shareholder returns through an impressive dividend history, extending over 35 years. As the company approaches a dividend yield of 4.28%, its current dividend per share stands at approximately $1.06 USD. Yet, careful examination of its payout ratios suggests potential financial stress as reflected by an EPS-based payout ratio exceeding 115%, prompting a deeper focus on its cash flow dynamics and dividend sustainability.
📊 Overview
The following table provides a summarized view of Kimco Realty Corporation’s dividend profile, outlining the key metrics that are pivotal in assessing its income-generating potential.
| Sector | Dividend Yield | Current Dividend per Share (USD) | Dividend History (Years) | Last Cut/Suspension |
|---|---|---|---|---|
| Real Estate | 4.28% | 1.06 USD | 35 years | None |
📈 Dividend History
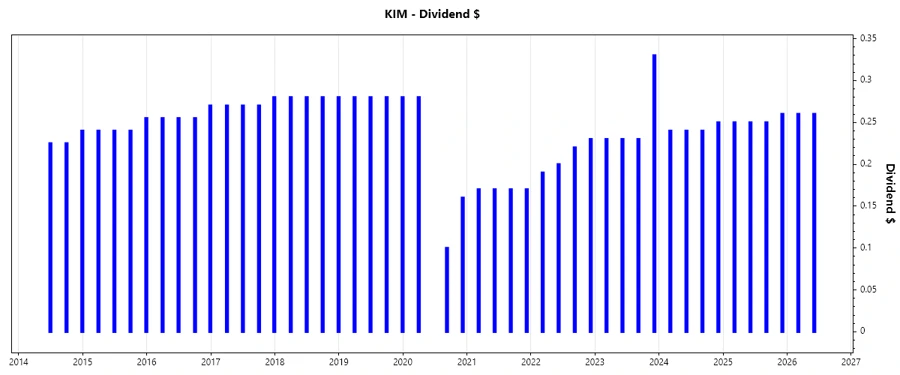
Kimco Realty's robust dividend history highlights financial stability and a long-term commitment to shareholder rewards, marking 35 consecutive years of payouts. This illustrious track record is critical, setting a reassuring precedent for investors seeking consistent income, especially in volatile markets.
| Year | Dividend per Share (USD) |
|---|---|
| 2026 | 0.52 |
| 2025 | 1.01 |
| 2024 | 0.97 |
| 2023 | 1.02 |
| 2022 | 0.84 |
📉 Dividend Growth
Dividend growth is a critical indicator of a company's financial health and its potential for future value creation. Over the last 5 years, Kimco Realty Corporation boasts a modest average dividend growth rate, signaling prudent financial management and a cautious approach in volatile economic environments.
| Time | Growth |
|---|---|
| 3 years | 6.34% |
| 5 years | 13.34% |
The average dividend growth is 13.34% over 5 years. This shows moderate but steady dividend growth.
✅ Payout Ratio
The payout ratio provides insights into the portion of earnings distributed as dividends, which is crucial in assessing dividend sustainability. An elevated ratio may imply potential pressures on future dividends, as it limits reinvestment capabilities.
| Key Figure | Ratio |
|---|---|
| EPS-based | 115.61% |
| Free cash flow-based | 91.65% |
The EPS-based payout ratio of 115.61% and FCF payout ratio of 91.65% suggest potential strain, implying dividend payments currently exceed earnings, highlighting potential liquidity challenges.
Cashflow & Capital Efficiency
Understanding the cash flow and capital efficiency ratios provides a comprehensive view of the company's operational efficiency and financial health, directly impacting its dividend-paying ability and growth potential.
| Metric | 2023 | 2024 | 2025 |
|---|---|---|---|
| Free Cash Flow Yield | 6.14% | 4.33% | 5.65% |
| Earnings Yield | 4.98% | 2.61% | 4.28% |
| CAPEX to Operating Cash Flow | 24.67% | 32.27% | 31.51% |
| Stock-based Compensation to Revenue | 1.85% | 1.71% | 0% |
| Free Cash Flow / Operating Cash Flow Ratio | 75.33% | 67.73% | 68.96% |
The displayed metrics indicate significant efficiency in operating cash management, though elevated capital expenses relative to operating cash flow underline potential reinvestment priorities necessitating careful evaluation.
Balance Sheet & Leverage Analysis
Analyzing Kimco Realty's balance sheet ratios offers critical insights into its financial leverage, liquidity, and overall solvency, fundamental for strategic planning and risk assessment.
| Metric | 2023 | 2024 | 2025 |
|---|---|---|---|
| Debt-to-Equity | 0.81 | 0.81 | 0.83 |
| Debt-to-Assets | 0.42 | 0.42 | 0.44 |
| Debt-to-Capital | 0.45 | 0.45 | 0.45 |
| Net Debt to EBITDA | 4.96 | 6.25 | 5.19 |
| Current Ratio | 6.42 | 3.58 | 1.08 |
| Quick Ratio | 6.42 | 3.58 | 1.08 |
| Financial Leverage | 1.92 | 1.91 | 1.89 |
The debt structure denotes moderate leverage with reasonable liquidity levels, essential in maintaining operational flexibility and ensuring long-term viability.
Fundamental Strength & Profitability
The company's fundamental strength, illustrated by profitability margins and efficiency ratios, provides a strong basis for evaluating its operational competitiveness and investment valuation.
| Metric | 2023 | 2024 | 2025 |
|---|---|---|---|
| Return on Equity | 6.87% | 3.86% | 5.62% |
| Return on Assets | 3.58% | 2.02% | 2.97% |
| Margins: Net | 36.69% | 20.17% | 27.29% |
| EBIT | 50.14% | 32.35% | 46.87% |
| EBITDA | 78.58% | 61.99% | 75.83% |
| Gross | 68.78% | 68.70% | 54.66% |
| Research & Development to Revenue | 0% | 0% | 0% |
The profitability metrics underscore Kimco Realty's solid and dependable returns, emphasizing its capacity to generate significant shareholder value compared to its competitors.
Price Development
Dividends Scoring System
The below scoring system evaluates Kimco Realty on pivotal financial metrics, facilitating a granular insight into its dividend capabilities and holistic financial stance.
| Criteria | Score | Score Bar |
|---|---|---|
| Dividend yield | 4 | |
| Dividend stability | 5 | |
| Dividend growth | 3 | |
| Payout ratio | 2 | |
| Financial stability | 3 | |
| Dividend continuity | 5 | |
| Cashflow coverage | 4 | |
| Balance sheet quality | 4 |
Total Score: 30/40
Rating
Based on the comprehensive analysis, Kimco Realty Corporation emerges as a moderately strong dividend player. With a high level of stability and continuity, it maintains an attractive yield and holds potential for income-focused investors. However, the high payout ratios warrant cautious scrutiny, with an emphasis on monitoring cash flow generation and reinvestment strategies.
Smart Data Insight
Master the Perfect Entry & Exit for this Stock
Don't leave your profits to chance. Historically, this stock follows specific seasonal patterns that institutional traders use to maximize returns.
- ✅ Identify the "Golden Buying Window"
- ✅ Avoid high-risk correction cycles
- ✅ Backtested data from the last 20+ years