May 14, 2026 a 07:46 am


KIM: Dividend Analysis - Kimco Realty Corporation
Kimco Realty Corporation demonstrates a robust dividend profile with a moderate dividend yield of 4.46% and a solid history of 35 years without any recent cuts or suspensions. However, with a high payout ratio based on EPS at over 115%, investors may want to monitor the company's earnings sustainability to maintain dividend payments.
📊 Overview
Kimco Realty Corporation operates within the real estate sector, offering investors a dividend yield of 4.46%. Its current dividend per share stands at 1.06 USD and boasts an impressive dividend history, having sustained payments for 35 years.
| Metric | Value |
|---|---|
| Sector | Real Estate |
| Dividend Yield | 4.46% |
| Current Dividend Per Share | 1.06 USD |
| Dividend History | 35 years |
| Last Cut or Suspension | None |
🗣️ Dividend History
Maintaining a long history of dividend payments is a positive indicator of financial health and stable cash flow generation capabilities. Kimco's commitment over the past decades reflects resilience, but monitoring EPS and cash flows remain crucial given its current payout levels.
| Year | Dividend Per Share |
|---|---|
| 2026 | 0.52 USD |
| 2025 | 1.01 USD |
| 2024 | 0.97 USD |
| 2023 | 1.02 USD |
| 2022 | 0.84 USD |
📈 Dividend Growth
Examining growth over recent periods provides insights into how effectively a company can enhance shareholder returns through dividend increases. Despite delivering growth over 3 and 5 years, a cautious outlook is advised due to its stretched payout ratios.
| Time | Growth |
|---|---|
| 3 years | 6.34% |
| 5 years | 13.34% |
The average dividend growth is 13.34% over 5 years. This shows moderate but steady dividend growth.
✅ Payout Ratio
Payout ratios assess the sustainability of dividends in relation to earnings and cash flow generation. Kimco's high EPS-based ratio of 115.61% raises red flags as dividends exceed net income, relying heavily on free cash flow, which stands more conservatively at 91.65%.
| Key figure | Ratio |
|---|---|
| EPS-based | 115.61% |
| Free cash flow-based | 91.65% |
📊 Cashflow & Capital Efficiency
Economic efficiency and sound cash flows are crucial for maintaining dividend distributions and investing in growth. Evaluating these metrics addresses operational robustness and profitability measures, vital amidst cyclical industry dynamics.
| Year | Free Cash Flow Yield | Earnings Yield | CAPEX to Operating Cash Flow | Stock-based Compensation to Revenue | Free Cash Flow / Operating Cash Flow Ratio |
|---|---|---|---|---|---|
| 2025 | 5.65% | 4.28% | 31.54% | 0% | 68.96% |
| 2024 | 4.33% | 2.61% | 32.27% | 1.71% | 67.73% |
| 2023 | 6.14% | 4.98% | 24.67% | 1.85% | 75.33% |
A solid FCF yield and improved capital efficiency reflect favorable conditions, though cautious evaluation of compensation strategies and investment in assets is recommended.
📊 Balance Sheet & Leverage Analysis
Financial stability, liquidity, and risk management are pivotal in analyzing company health. Assessment of leverage ratios and balance sheet robustness aids in understanding potential liabilities and solvency paths under varying economic conditions.
| Year | Debt-to-Equity | Debt-to-Assets | Debt-to-Capital | Net Debt to EBITDA | Current Ratio | Quick Ratio | Financial Leverage |
|---|---|---|---|---|---|---|---|
| 2025 | 0.83 | 0.44 | 0.45 | 5.28 | 2.32 | 1.08 | 1.89 |
| 2024 | 0.81 | 0.42 | 0.45 | 6.25 | 3.58 | 3.58 | 1.91 |
| 2023 | 0.81 | 0.42 | 0.45 | 4.96 | 6.42 | 6.42 | 1.92 |
While leveraging slightly increased, maintaining a balanced debt structure supported by strong liquidity signals resilience despite economic headwinds.
📊 Fundamental Strength & Profitability
Analyzing key performance indicators and margin metrics provides insight into operational effectiveness. Evaluating R&D investment against the net returns illustrates growth aspirations respecting cost structures and resource allocation.
| Year | Return on Equity | Return on Assets | Net Profit Margin | EBIT Margin | EBITDA Margin | Gross Margin | R&D to Revenue |
|---|---|---|---|---|---|---|---|
| 2025 | 5.62% | 2.97% | 27.29% | 46.87% | 75.83% | 54.66% | 0% |
| 2024 | 3.86% | 2.02% | 20.17% | 32.35% | 61.99% | 68.70% | 0% |
| 2023 | 6.87% | 3.58% | 36.69% | 50.14% | 78.58% | 68.78% | 0% |
ROE and margins underscore favorable profitability states, though stagnation in growth investment demands strategic reallocations to sustain competitive positioning.
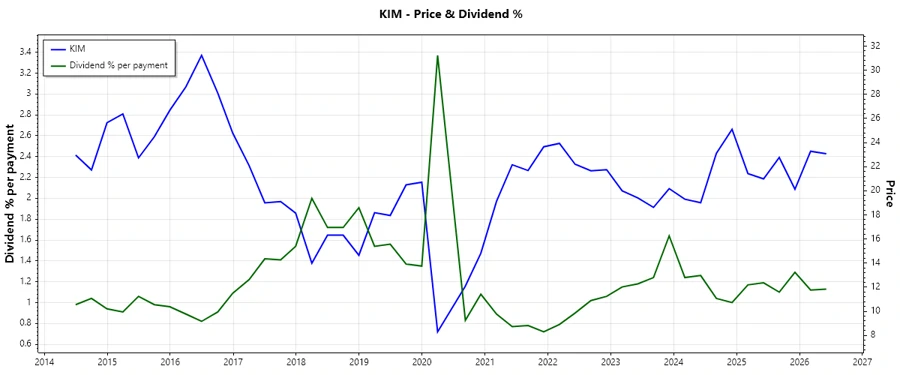
📈 Price Development
📉 Dividend Scoring System
| Criteria | Score | |
|---|---|---|
| Dividend yield | 4/5 | |
| Dividend Stability | 3/5 | |
| Dividend growth | 3/5 | |
| Payout ratio | 2/5 | |
| Financial stability | 3/5 | |
| Dividend continuity | 4/5 | |
| Cashflow Coverage | 3/5 | |
| Balance Sheet Quality | 3/5 |
Total Score: 25/40
⚠️ Rating
Kimco Realty Corporation presents a mixed dividend profile with a robust yield and longstanding history, moderated by potential sustainability challenges. With a high payout ratio and moderate growth, it is advisable to weigh the yield benefits against possible earnings volatility.
Smart Data Insight
Master the Perfect Entry & Exit for this Stock
Don't leave your profits to chance. Historically, this stock follows specific seasonal patterns that institutional traders use to maximize returns.
- ✅ Identify the "Golden Buying Window"
- ✅ Avoid high-risk correction cycles
- ✅ Backtested data from the last 20+ years