April 12, 2026 a 03:30 am


KIM: Dividend Analysis - Kimco Realty Corporation
Kimco Realty Corporation showcases a stable dividend profile with a noteworthy track record of 35 years of uninterrupted dividend payments. However, the high EPS payout ratio and the company's REIT status emphasize careful consideration for sustainable growth in dividends. Investors should weigh the attractive yield of 4.38%, with an awareness of the fluctuating payout ratios.
Overview 📊
The following table provides an overview of key dividend metrics for Kimco Realty Corporation, giving investors a snapshot of its dividend yield, continuity, and any historical cuts or suspensions.
| Sector | Dividend Yield | Current Dividend per Share | Dividend History | Last Cut or Suspension |
|---|---|---|---|---|
| Real Estate | 4.38 % | 1.06 USD | 35 years | None |
Dividend History 📈
Reviewing the dividend history aids investors in gauging the consistency and reliability of dividend payments, a critical factor for income-focused investors.
| Year | Dividend per Share (USD) |
|---|---|
| 2026 | 0.26 |
| 2025 | 1.01 |
| 2024 | 0.97 |
| 2023 | 1.02 |
| 2022 | 0.84 |
Dividend Growth 🏆
Dividend growth analysis is vital for assessing the future income potential and sustainability of dividends over time. Here’s a look at Kimco’s growth over recent years.
| Time | Growth |
|---|---|
| 3 years | 6.34 % |
| 5 years | 13.34 % |
The average dividend growth is 13.34% over 5 years. This shows moderate but steady dividend growth.
Payout Ratio ⚠️
The payout ratio provides insight into the dividend sustainability. High payout ratios can indicate potential difficulty in maintaining current dividend levels, particularly during challenging market conditions.
| Key figure | Ratio |
|---|---|
| EPS-based | 122.34 % |
| Free cash flow-based | 92.58 % |
The EPS payout ratio of 122.34% and FCF payout ratio of 92.58% suggest a high distribution from earnings, indicating potential challenges in dividend sustainability if earnings fluctuate.
Cashflow & Capital Efficiency 💵
Analysis of cash flows and capital efficiency is essential to assess the company's financial health, sustainability of dividend payments, and return on investments.
| Metric | 2023 | 2024 | 2025 |
|---|---|---|---|
| Free Cash Flow Yield | 6.14 % | 4.33 % | 5.65 % |
| Earnings Yield | 4.98 % | 2.61 % | 4.28 % |
| CAPEX to Operating Cash Flow | 24.67 % | 32.27 % | 31.04 % |
| Stock-based Compensation to Revenue | 1.85 % | 1.71 % | 0 % |
| Free Cash Flow / Operating Cash Flow Ratio | 75.33 % | 67.73 % | 68.96 % |
| Return on Invested Capital | 3.24 % | 2.96 % | 3.80 % |
Overall, the company's cash flow and capital efficiency are supportive of its dividend strategy, but vigilance over FCF coverage is advised.
Balance Sheet & Leverage Analysis 📋
An effective balance sheet analysis helps evaluate the company’s financial resilience and debt management strategies.
| Metric | 2023 | 2024 | 2025 |
|---|---|---|---|
| Debt-to-Equity | 0.81 | 0.81 | 0.83 |
| Debt-to-Assets | 42.28 % | 42.24 % | 43.89 % |
| Debt-to-Capital | 44.79 % | 44.61 % | 45.40 % |
| Net Debt to EBITDA | 4.96 | 6.25 | 5.19 |
| Current Ratio | 6.42 | 3.58 | 1.08 |
| Quick Ratio | 6.42 | 3.58 | 1.08 |
| Financial Leverage | 1.92 | 1.91 | 1.89 |
The company's leverage ratios indicate moderate financial stability with a mix of debt, requiring careful monitoring of its leverage and liquidity position.
Fundamental Strength & Profitability 📊
Fundamental strength and profitability metrics illustrate the company’s ability to generate returns and maintain competitive advantages in the marketplace.
| Metric | 2023 | 2024 | 2025 |
|---|---|---|---|
| Return on Equity | 6.87 % | 3.86 % | 5.62 % |
| Return on Assets | 3.58 % | 2.02 % | 2.97 % |
| Net Margin | 36.69 % | 20.17 % | 27.29 % |
| EBIT Margin | 50.14 % | 32.35 % | 46.87 % |
| EBITDA Margin | 78.58 % | 61.99 % | 75.83 % |
| Gross Margin | 68.78 % | 68.70 % | 54.66 % |
| R&D to Revenue | 0 % | 0 % | 0 % |
Current profitability figures suggest robust margin maintenance, with potential for improvements in asset and equity utilization.
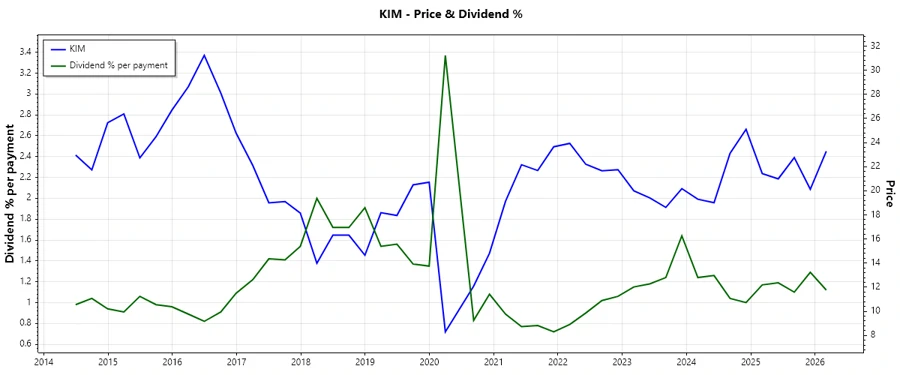
Price Development 🎢
Dividend Scoring System 🏅
| Category | Score | Score Bar |
|---|---|---|
| Dividend Yield | 4 | |
| Dividend Stability | 5 | |
| Dividend Growth | 3 | |
| Payout Ratio | 2 | |
| Financial Stability | 3 | |
| Dividend Continuity | 5 | |
| Cashflow Coverage | 3 | |
| Balance Sheet Quality | 3 |
Total Score: 28/40
Rating 🗣️
Kimco Realty Corporation exemplifies a strong position in the real estate sector with a compelling dividend history and yield. Despite a high payout ratio, the company's financial structure suggests stability but requires continuous monitoring for maintained dividend payouts amidst potential market changes. It remains a viable option for dividend-focused portfolios seeking steady income with moderate growth potential.