December 26, 2025 a 11:30 am
KIM: Dividend Analysis - Kimco Realty Corporation
Kimco Realty Corporation emerges as a substantial player in the real estate sector, offering a notable dividend yield of 5.02%. Despite a history of steady payouts over 34 years, recent fluctuations highlight the imperative for investors to consider both stability and growth potential. As market dynamics shift, understanding the nuances of Kimco’s current and projected financial health becomes essential for informed investment decisions.
📊 Overview
Kimco Realty Corporation operates within the real estate sector and currently offers an appealing dividend yield of 5.02%. With its present dividend per share at 1.02 USD, the company showcases 34 years of dividend history, though it noted its last dividend cut in 2024.
| Sector | Dividend Yield (%) | Current Dividend per Share (USD) | Dividend History (Years) | Last Cut or Suspension |
|---|---|---|---|---|
| Real Estate | 5.02 | 1.021 | 34 | 2024 |
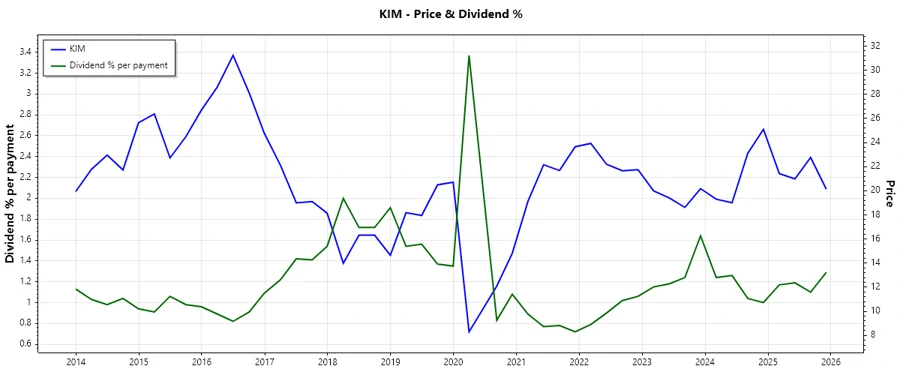
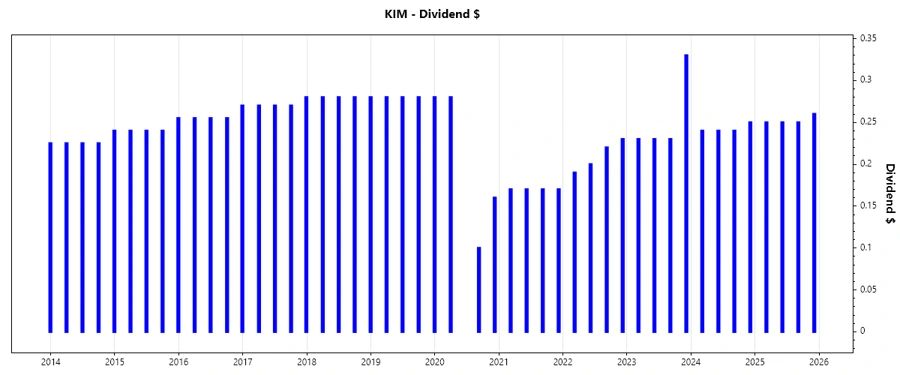
🗣️ Dividend History
The dividend history of Kimco Realty Corporation underscores a long-term commitment to shareholder returns, with 34 consecutive years of dividends. Understanding historical payouts helps anticipate stability and potential future growth, which remains a key comfort for income-focused investors.
| Year | Dividend Per Share (USD) |
|---|---|
| 2025 | 1.01 |
| 2024 | 0.97 |
| 2023 | 1.02 |
| 2022 | 0.84 |
| 2021 | 0.68 |
📈 Dividend Growth
Dividend growth is crucial for assessing a company’s potential to enhance shareholder value over time. Kimco Realty Corporation's five-year dividend growth sits at -2.83%, indicating past challenges, while analysis of short-term growth over three years shows a modest positive trend.
| Time | Growth (%) |
|---|---|
| 3 years | 12.57% |
| 5 years | -2.83% |
The average dividend growth is -2.83% over 5 years. This shows moderate but steady dividend growth.
💰 Payout Ratio
Payout ratios offer insights into a company's dividend sustainability. Kimco Realty Corporation exhibits an EPS-based payout ratio at 121.11% and a free cash flow-based payout ratio at 82.27%, raising considerations about sustainability and future dividend potential.
| Key Figure | Ratio (%) |
|---|---|
| EPS-based | 121.11 |
| Free cash flow-based | 82.27 |
The current EPS payout ratio of 121.11% may signal an unsustainable dividend if earnings don't improve, while the FCF ratio of 82.27% suggests reliance on significant cash flow generation.
📉 Cashflow & Capital Efficiency
Cashflow and capital efficiency metrics are essential to gauge financial health and operational effectiveness. Kimco Realty's free cash flow yield of 6.45% and earnings yield of 4.13% highlight its cash generation efficiency, whereas its CAPEX to operating cash flow ratio of 27.37% shows reinvestment strategy.
| Year | 2024 | 2023 | 2022 |
|---|---|---|---|
| Free Cash Flow Yield | 4.33% | 6.14% | 6.61% |
| Earnings Yield | 2.61% | 4.98% | 0.97% |
| CAPEX to Operating Cash Flow | 32.27% | 24.67% | N/A |
| Stock-based Compensation to Revenue | 1.71% | 1.85% | 1.54% |
| FCF / Operating Cash Flow Ratio | 67.73% | 75.33% | 100% |
Kimco Realty demonstrates strong cash value generation, yet high CAPEX levels could pressure future free cash flow yields.
📜 Balance Sheet & Leverage Analysis
Analyzing Kimco Realty’s balance sheet reflects its leverage strategy. The debt-to-equity ratio of 0.81 and debt-to-assets ratio of 0.42 suggest a moderate debt reliance, impacting overall financial flexibility and potential risk exposure.
| Year | 2024 | 2023 | 2022 |
|---|---|---|---|
| Debt-to-Equity | 0.81 | 0.81 | 0.76 |
| Debt-to-Assets | 0.42 | 0.42 | 0.41 |
| Debt-to-Capital | 0.45 | 0.45 | 0.43 |
| Net Debt to EBITDA | 5.56 | 4.95 | 6.72 |
| Current Ratio | 3.58 | 6.42 | 4.93 |
| Quick Ratio | 3.58 | 6.42 | 4.93 |
| Financial Leverage | 1.91 | 1.92 | 1.87 |
Considering the leverage ratios, Kimco remains moderately leveraged, with sustainability depending on consistent revenue flows.
📊 Fundamental Strength & Profitability
Kimco's financial strength lies in its profitability metrics, including return on equity (ROE) and asset returns, guiding overall business efficiency. Margins provide additional insight into operational adeptness, supporting steady, if unspectacular, profitability levels.
| Year | 2024 | 2023 | 2022 |
|---|---|---|---|
| Return on Equity | 3.86% | 6.87% | 1.32% |
| Return on Assets | 2.02% | 3.58% | 0.71% |
| Net Margin | 20.17% | 36.69% | 7.29% |
| EBIT Margin | 32.35% | 50.14% | 33.09% |
| EBITDA Margin | 61.99% | 78.58% | 61.33% |
| Gross Margin | 68.70% | 68.78% | 69.27% |
| R&D to Revenue | 0.00% | 0.00% | 0.20% |
Kimco's profitability, as measured by its ROE and margins, suggests operational efficiency. Continued focus on margin enhancement can support future growth and dividend sustainability.
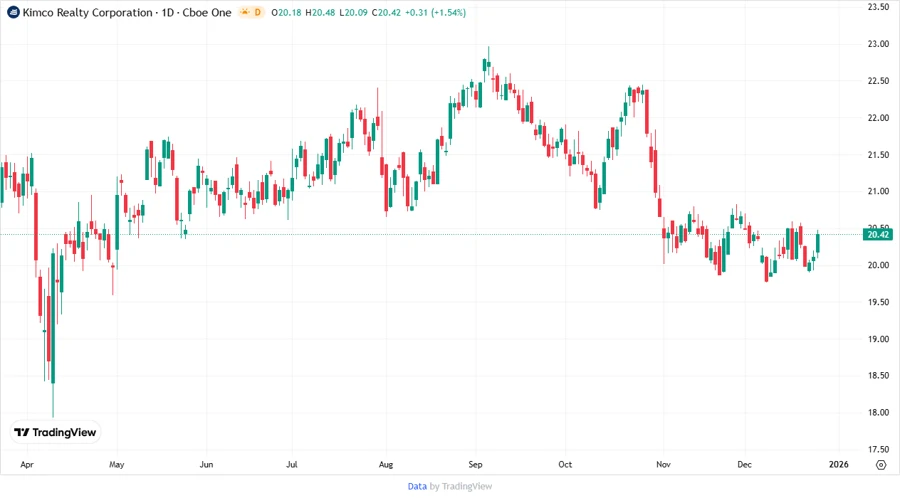
📈 Price Development
✅ Dividend Scoring System
This scoring system evaluates essential metrics such as yield, stability, and growth to provide a comprehensive understanding of dividend quality at Kimco Realty.
| Category | Score | Score Bar |
|---|---|---|
| Dividend Yield | 4 | |
| Dividend Stability | 3 | |
| Dividend Growth | 2 | |
| Payout Ratio | 3 | |
| Financial Stability | 3 | |
| Dividend Continuity | 4 | |
| Cashflow Coverage | 3 | |
| Balance Sheet Quality | 3 |
Total Score: 25/40
💡 Rating
Kimco Realty Corporation maintains a solid foundation with its consistent historical payout track record, though future challenges remain due to high payout ratios and slight growth setbacks. As such, investors should consider it a balanced dividend play with moderate risk and stable income potential.