December 02, 2025 a 12:46 pm


KIM: Dividend Analysis - Kimco Realty Corporation
As a notable player in the Real Estate sector, Kimco Realty Corporation exhibits a steady dividend yield of 4.93%. Despite a historical dividend payout spanning 34 years, recent trends show a concerning dividend cut in 2024. Investors should monitor the high payout ratio signaling caution.
📊 Overview
Kimco Realty Corporation operates within the Real Estate sector, boasting a robust dividend profile characterized by a current dividend yield of 4.93% and a dividend history extending over 34 years. The recent dividend suspension in 2024 remains a critical point for assessment.
| Aspect | Detail |
|---|---|
| Sector | Real Estate |
| Dividend yield | 4.93% |
| Current dividend per share | 1.02 USD |
| Dividend history | 34 years |
| Last cut or suspension | 2024 |
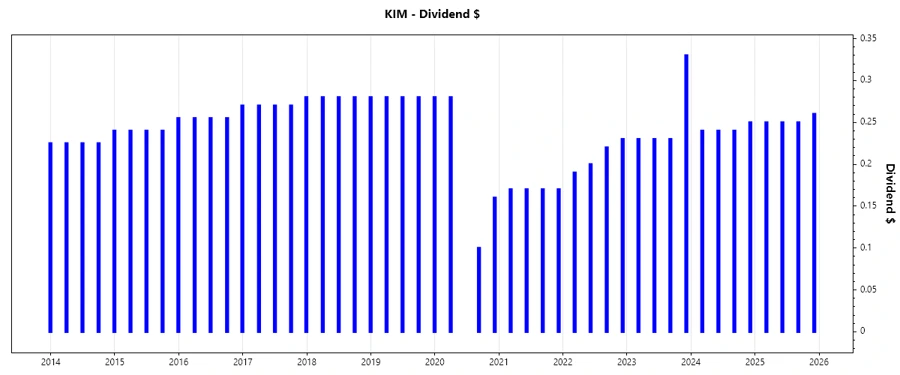
🗣️ Dividend History
Kimco's track record indicates impressive dividend sustainability over decades. However, a recent drop could worry dividend-dependent investors.
| Year | Dividend per Share (USD) |
|---|---|
| 2025 | 1.01 |
| 2024 | 0.97 |
| 2023 | 1.02 |
| 2022 | 0.84 |
| 2021 | 0.68 |
📈 Dividend Growth
Analyzing the dividend growth trend reveals challenges, with a 3-year average growth indicating positive movement of 12.57%, while a concerning 5-year decline of -2.83% prompts scrutiny by stakeholders.
| Time | Growth |
|---|---|
| 3 years | 12.57% |
| 5 years | -2.83% |
The average dividend growth is -2.83% over 5 years. This shows moderate but steady dividend growth.
⚠️ Payout Ratio
Payout ratios offer insights into the company's earnings distribution to dividends. With an EPS-based payout over 115% and FCF-based ratio around 91.22%, caution is advised as high payouts may not be sustainable long-term.
| Key Figure | Ratio |
|---|---|
| EPS-based | 115.04% |
| Free cash flow-based | 91.22% |
📉 Cashflow & Capital Efficiency
The efficiency and capital allocation proficiency can indicate the firm's ability to sustain dividends over time. Kimco displays strong earnings and free cash flow yields, though cautious CAPEX management is recommended to sustain operating cash flow ratios.
| Metrics | 2024 | 2023 | 2022 |
|---|---|---|---|
| Free Cash Flow Yield | 4.33% | 6.14% | 6.61% |
| Earnings Yield | 2.61% | 4.98% | 0.97% |
| CAPEX to Operating Cash Flow | 31.15% | 24.67% | 0% |
| Stock-based Compensation to Revenue | 1.71% | 1.85% | 1.54% |
| Free Cash Flow / Operating Cash Flow Ratio | 67.73% | 75.33% | 100.00% |
The cash flow yielded steady returns, but potential over-reliance on financial leverage indicated by net debt to EBITDA should be closely monitored.
🔍 Balance Sheet & Leverage Analysis
Strong balance sheet assessments focus on debt and equity proportion, essential to maintaining financial resilience, especially in adverse market conditions. Despite relatively favorable asset-to-debt ratios, more rigorous financial leverage scrutiny is needed given current market dynamics.
| Metrics | 2024 | 2023 | 2022 |
|---|---|---|---|
| Debt-to-Equity | 0.81 | 0.81 | 0.76 |
| Debt-to-Assets | 42.24% | 42.28% | 40.79% |
| Debt-to-Capital | 44.61% | 44.79% | 43.32% |
| Net Debt to EBITDA | 6.06 | 4.96 | 9.18 |
| Current Ratio | 2.43 | 6.42 | 4.93 |
| Quick Ratio | 3.58 | 6.42 | 4.93 |
| Financial Leverage | 1.91 | 1.92 | 1.87 |
While the debt-to-equity ratio is manageable, high net debt to EBITDA necessitates focused financial management to maintain flexibility and avoid cash flow stress.
💪 Fundamental Strength & Profitability
Profitability metrics like ROI and profit margins illustrate the firm's effectiveness in generating shareholder wealth. Despite the sturdy margins, the modest return on equity and assets suggests room for operational improvement.
| Metrics | 2024 | 2023 | 2022 |
|---|---|---|---|
| Return on Equity | 3.86% | 6.87% | 1.32% |
| Return on Assets | 2.02% | 3.58% | 0.71% |
| Net Profit Margin | 20.17% | 36.69% | 7.29% |
| EBIT Margin | 32.35% | 50.14% | 15.69% |
| EBITDA Margin | 61.99% | 78.58% | 44.92% |
| Gross Margin | 68.70% | 68.78% | 69.27% |
| Research & Development to Revenue | 0% | 0% | 0% |
Strong profit margins are promising, indicative of potential to realize operational efficiencies with strategic investment in revenue-generating initiatives.
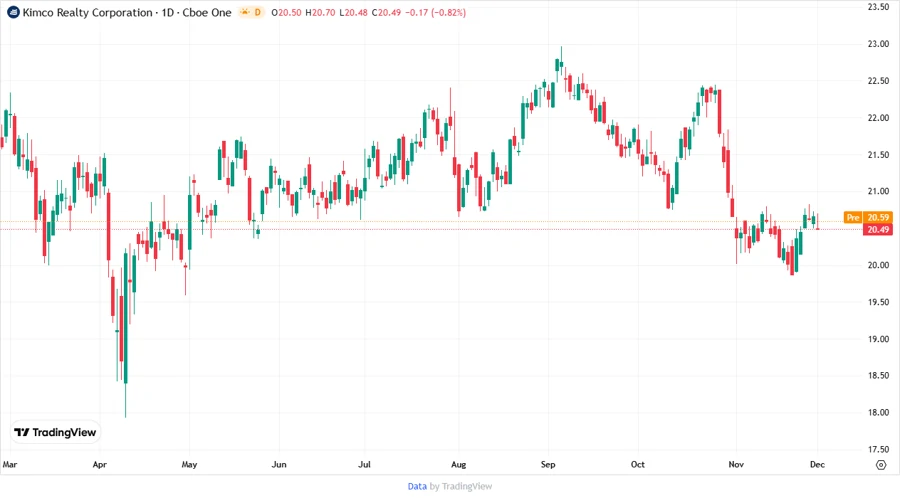
📉 Price Development
✅ Dividend Scoring System
Kimco's commitment to dividends is analyzed across several parameters, utilizing a comprehensive scoring model. Notably, particular focus on growth consistency and financial stability is essential for long-term stakeholders.
| Criteria | Score | Gauge |
|---|---|---|
| Dividend yield | 4 | |
| Dividend Stability | 3 | |
| Dividend Growth | 2 | |
| Payout ratio | 2 | |
| Financial stability | 3 | |
| Dividend continuity | 3 | |
| Cashflow Coverage | 3 | |
| Balance Sheet Quality | 3 |
Total Score: 23 out of 40 points
🔍 Rating
Kimco Realty Corporation maintains a compelling dividend profile with remarkable yield. Investors should remain attentive to fluctuations in growth and payout ratios while leveraging the company's underlying financial strengths for strategic planning.