October 21, 2025 a 07:47 am

KIM: Dividend Analysis - Kimco Realty Corporation
Kimco Realty Corporation demonstrates a robust dividend profile with an impressive dividend history of 34 years. Despite the challenges, the company maintains a competitive dividend yield of 4.39%, reflecting its dedication to rewarding shareholders. The current dividend per share stands at $1.02, showcasing the company's commitment to maintaining consistent payouts. Investors should note the last dividend cut occurred less than ideally prepared but has since shown resilience.
📊 Overview
Kimco Realty Corporation operates in the Real Estate Investment Trusts (REITs) sector. The company's current dividend yield is a notable 4.39%, positioning it favorably in terms of income generation. With a solid dividend history spanning 34 years, the company demonstrates reliability in payout continuity, with no recent cuts in 2023.
| Metric | Value |
|---|---|
| Sector | Real Estate Investment Trusts (REITs) |
| Dividend Yield | 4.39% |
| Current Dividend per Share | $1.02 |
| Dividend History | 34 years |
| Last Cut or Suspension | None |
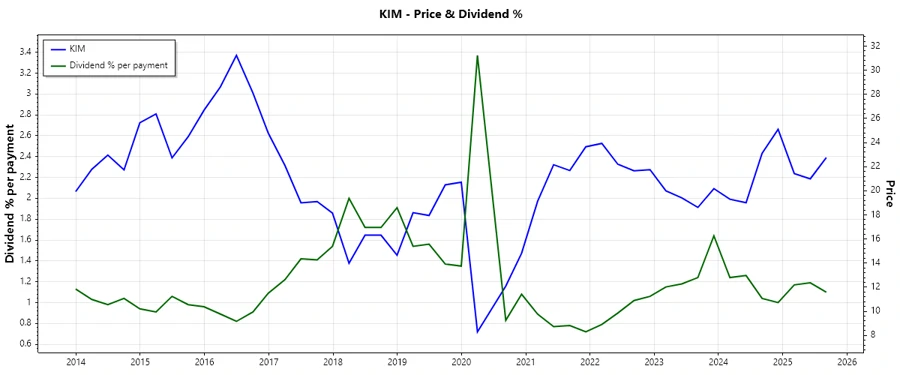
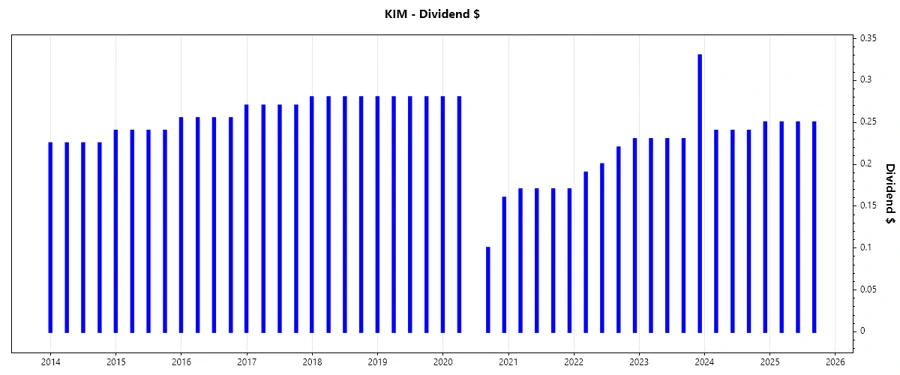
🗣️ Dividend History
The historical dividend payments reflect Kimco's stability and commitment towards returning value to shareholders. Regular dividends contribute to income predictability and investor confidence.
| Year | Dividend per Share (USD) |
|---|---|
| 2025 | 0.75 |
| 2024 | 0.97 |
| 2023 | 1.02 |
| 2022 | 0.84 |
| 2021 | 0.68 |
📈 Dividend Growth
Understanding dividend growth is crucial as it indicates potential for future income enhancement and reflects the company’s earnings strength. Although the 5-year growth rate is slightly negative, recent trends display a rise in payouts.
| Time | Growth |
|---|---|
| 3 years | 12.57% |
| 5 years | -2.83% |
The average dividend growth is -2.83% over 5 years. This shows moderate but steady dividend growth despite economic pressures.
✅ Payout Ratio
The payout ratio is a crucial indicator of the sustainability of dividend payments. A high payout ratio could signal potential risks if earnings decline.
| Key Figure | Ratio |
|---|---|
| EPS-based | 115.67% |
| Free cash flow-based | 70.68% |
While an EPS-based payout ratio of 115.67% might seem unsustainable, the free cash flow-based ratio of 70.68% is a more reassuring indicator of the company's ability to support its dividends.
⚠️ Cashflow & Capital Efficiency
Robust cash flow generation and efficient capital allocation are pivotal for ensuring ongoing dividend payments. Here is a detailed breakdown of these metrics over recent years:
| Year | 2022 | 2023 | 2024 |
|---|---|---|---|
| Free Cash Flow Yield | 6.61% | 8.15% | 6.39% |
| Earnings Yield | 0.97% | 4.98% | 2.61% |
| CAPEX to Operating Cash Flow | 8.09% | 0.00% | 0.00% |
| Stock-based Compensation to Revenue | 1.54% | 1.85% | 1.71% |
| Free Cash Flow / Operating Cash Flow Ratio | 1.00 | 1.00 | 1.00 |
The data signifies a strong cash flow position with consistent free cash flow compared to operating cash flow, providing a solid foundation for sustained dividend payments and growth investments.
📉 Balance Sheet & Leverage Analysis
Assessing leverage is vital for understanding financial health and the company’s ability to withstand economic downturns. Here is a breakdown of leverage and balance sheet quality:
| Year | 2022 | 2023 | 2024 |
|---|---|---|---|
| Debt-to-Equity | 76.42% | 81.12% | 80.53% |
| Debt-to-Assets | 42.28% | 42.28% | 42.23% |
| Debt-to-Capital | 44.32% | 44.79% | 44.61% |
| Net Debt to EBITDA | 9.18 | 4.96 | 6.25 |
| Current Ratio | 4.93 | 6.42 | 3.58 |
| Quick Ratio | 4.93 | 6.42 | 3.58 |
| Financial Leverage | 1.87 | 1.91 | 1.91 |
Kimco Realty Corporation maintains a manageable level of leverage, supporting its capacity for steady dividend payments. The current and quick ratios suggest strong liquidity, vital for operational flexibility.
📊 Fundamental Strength & Profitability
Profitability ratios and fundamental analysis provide insights into operational efficiency and financial robustness:
| Year | 2022 | 2023 | 2024 |
|---|---|---|---|
| Return on Equity | 1.32% | 6.87% | 3.86% |
| Return on Assets | 0.71% | 3.58% | 2.02% |
| Gross Margin | 69.27% | 68.78% | 68.70% |
| EBIT Margin | 15.69% | 50.14% | 32.35% |
| EBITDA Margin | 44.92% | 78.58% | 61.99% |
| Research & Development to Revenue | 0% | 0% | 0% |
The moderate return on equity and assets signify an efficient use of capital. The consistent gross and EBITDA margins are indicators of strong pricing power and cost control.
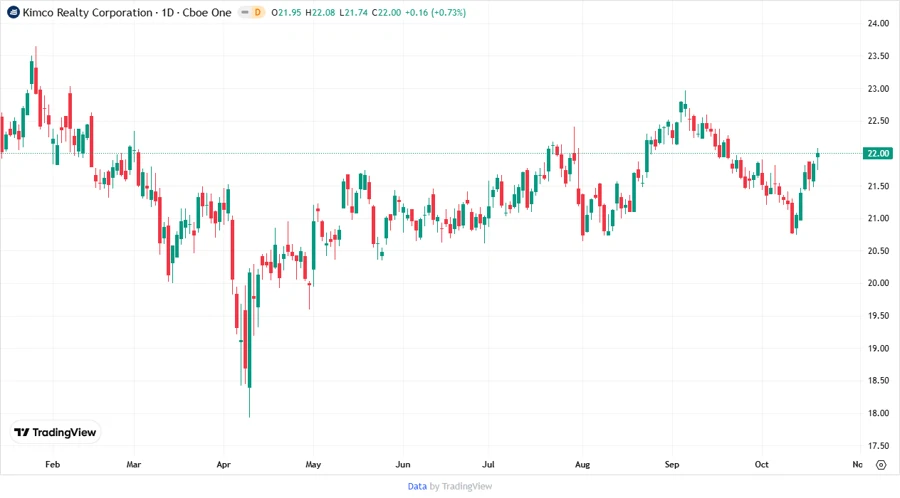
📈 Price Development
🔍 Dividend Scoring System
| Criteria | Score | Score Bar |
|---|---|---|
| Dividend Yield | 4 | |
| Dividend Stability | 5 | |
| Dividend Growth | 3 | |
| Payout Ratio | 3 | |
| Financial Stability | 4 | |
| Dividend Continuity | 5 | |
| Cashflow Coverage | 5 | |
| Balance Sheet Quality | 4 |
Total Score: 33/40
🌟 Rating
Kimco Realty Corporation reflects a firm dividend profile with promising stability and a robust balance sheet. Although dividend growth remains a challenge, strong cash flows support the current payouts. Therefore, the stock is recommended for income-focused investors seeking stable returns in the REIT domain.
Smart Data Insight
Master the Perfect Entry & Exit for this Stock
Don't leave your profits to chance. Historically, this stock follows specific seasonal patterns that institutional traders use to maximize returns.
- ✅ Identify the "Golden Buying Window"
- ✅ Avoid high-risk correction cycles
- ✅ Backtested data from the last 20+ years