September 13, 2025 a 03:31 am

KIM: Dividend Analysis - Kimco Realty Corporation
Kimco Realty Corporation, renowned for its consistent dividend history over 34 years, showcases a strong dividend yield of 4.39%. Although recent years have seen fluctuations, the company's commitment to shareholder returns remains evident. Potential investors should consider both the growth potential and current industry challenges while assessing their investment in Kimco.
📊 Overview
Kimco Realty Corporation is positioned within the Real Estate sector, indicative of its focus on investment in real estate properties. The company's dividend profile reflects a robust history, although with moderate yield and payment adjustments over time.
| Attribute | Details |
|---|---|
| Sector | Real Estate |
| Dividend yield | 4.39% |
| Current dividend per share | 1.02 USD |
| Dividend history | 34 years |
| Last cut or suspension | None |
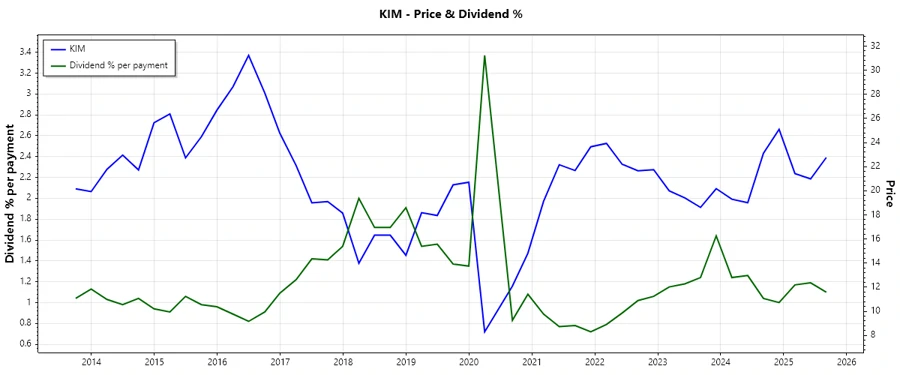
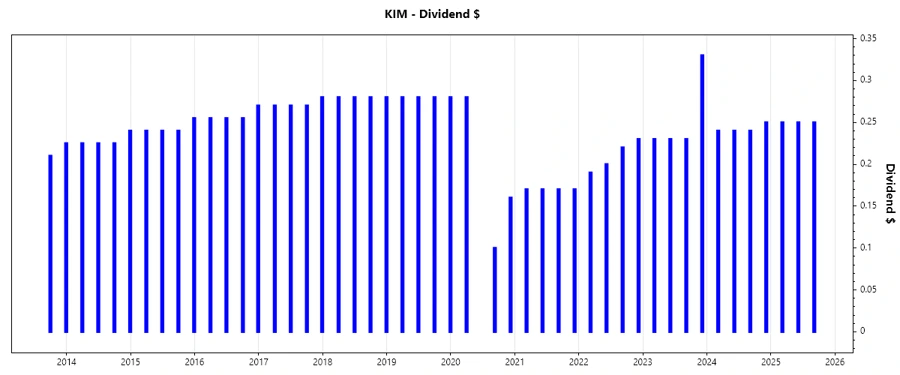
📉 Dividend History
The company's dividend history showcases resilience. With over three decades of regular dividends, Kimco demonstrates a history of commitment to returning capital to shareholders. Such consistency is crucial for investors seeking steady income streams amidst market volatility.
| Year | Dividend per Share (USD) |
|---|---|
| 2025 | 0.75 |
| 2024 | 0.97 |
| 2023 | 1.02 |
| 2022 | 0.84 |
| 2021 | 0.68 |
📈 Dividend Growth
Understanding dividend growth is essential as it signals the earnings growth potential of a company. Kimco's three-year dividend growth stands at 12.57%, whereas a five-year observation shows a slight decline of 2.83% indicating temporary challenges.
| Time | Growth |
|---|---|
| 3 years | 12.57% |
| 5 years | -2.83% |
The average dividend growth is -2.83% over 5 years. This shows moderate but steady dividend growth. Investors should weigh these figures against their expectations for future performance.
✅ Payout Ratio
The payout ratio provides insight into how much of a company’s earnings are being returned to shareholders versus retained for growth. Kimco's current EPS-based payout ratio is 115.67%, which is relatively high, signalling potential risks in maintaining dividend payments from profits.
| Key figure | Ratio |
|---|---|
| EPS-based | 115.67% |
| Free cash flow-based | 91.09% |
The EPS payout ratio of 115.67% indicates that dividends exceed net income, potentially unsustainable long-term. However, the free cash flow-based payout ratio is more reasonable at 91.09%, though still high.
💰 Cashflow & Capital Efficiency
Maintaining a healthy cash flow is vital for dividend sustainability. Kimco’s free cash flow yield reflects adequate generation of cash from operations relative to its market value, ensuring that dividend obligations are met.
| Metric | 2024 | 2023 | 2022 |
|---|---|---|---|
| Free Cash Flow Yield | 6.39% | 8.15% | 6.61% |
| Earnings Yield | 2.61% | 4.98% | -0.09% |
| CAPEX to Operating Cash Flow | 0% | 0% | 0% |
| Stock-based Compensation to Revenue | 0.017% | 0.019% | 0.015% |
| Free Cash Flow / Operating Cash Flow Ratio | 100% | 100% | 100% |
The stability in cash flow metrics underscores Kimco’s efficiency in managing its capital. The high free cash flow yield suggests robust income generation relative to its market capitalization.
📉 Balance Sheet & Leverage Analysis
Analysis of leverage ratios provides an understanding of financial health. A lower ratio suggests more equity funding, offering greater financial stability and lower risk.
| Metric | 2024 | 2023 | 2022 |
|---|---|---|---|
| Debt-to-Equity | 0.805 | 0.811 | 0.764 |
| Debt-to-Assets | 0.422 | 0.423 | 0.408 |
| Debt-to-Capital | 0.446 | 0.448 | 0.433 |
| Net Debt to EBITDA | 6.25 | 6.37 | 6.61 |
| Current Ratio | 3.82 | 6.42 | 4.93 |
| Quick Ratio | 3.82 | 6.42 | 4.93 |
| Financial Leverage | 1.91 | 1.92 | 1.87 |
Kimco’s debt metrics suggest balanced utilization of borrowing with substantial equity support. This strategic leverage usage maintains its operational expansion while minimizing excessive risk.
🗣️ Fundamental Strength & Profitability
Profitability ratios such as Return on Equity and Margins are indicators of the company's operational efficiency and profitability.
| Metric | 2024 | 2023 | 2022 |
|---|---|---|---|
| Return on Equity | 3.86% | 6.87% | -0.13% |
| Return on Assets | 2.02% | 3.58% | -0.07% |
| Margins: Net | 20.17% | 36.69% | -0.71% |
| Margins: EBIT | 32.35% | 50.13% | 15.69% |
| Margins: EBITDA | 61.99% | 61.11% | 62.35% |
| Margins: Gross | 68.70% | 68.78% | 69.27% |
| R&D to Revenue | 0% | 0% | 0% |
Kimco's mixed profitability outcomes over various metrics suggest quality earnings, yet a need for improved asset and equity utilization for higher returns.
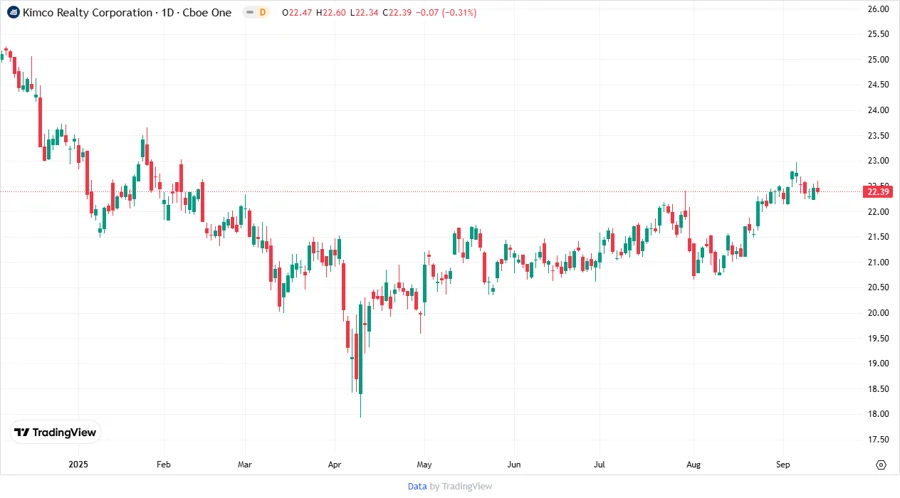
Price Development
🔍 Dividend Scoring System
| Category | Score | Score Bar |
|---|---|---|
| Dividend yield | 4 | |
| Dividend Stability | 5 | |
| Dividend growth | 2 | |
| Payout ratio | 3 | |
| Financial stability | 4 | |
| Dividend continuity | 5 | |
| Cashflow Coverage | 4 | |
| Balance Sheet Quality | 4 |
Total Score: 31/40
Rating
Kimco Realty Corporation offers a compelling investment opportunity with a high dividend yield and extensive history of dividend payments. While certain profitability metrics require attention, the company's overall stability and cash flow generators support its ability to meet dividend commitments. Investors seeking reliable income in the Real Estate sector should consider Kimco as a component of a diversified portfolio.