May 24, 2025 a 12:46 pm


KIM: Dividend Analysis - Kimco Realty Corporation
Kimco Realty Corporation showcases a promising dividend profile with historical resilience. With a dividend history spanning 34 years and no recent cuts, it represents stability and predictability for income-seeking investors. However, high payout ratios warrant a cautious approach, urging investors to scrutinize financial sustainability closely.
📊 Overview
Kimco Realty Corporation operates within the real estate sector, characterized by a competitive 4.83% dividend yield. The company has consistently paid dividends, maintaining a record of 34 years without major interruptions. However, caution is advised due to its substantial payout ratio based on EPS.
| Sector | Dividend Yield | Current Dividend per Share | Dividend History | Last Cut or Suspension |
|---|---|---|---|---|
| Real Estate | 4.83% | 1.02 USD | 34 years | None |
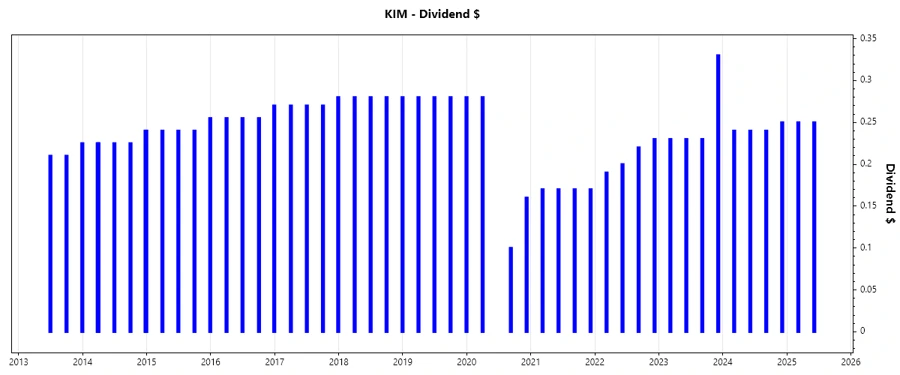
📈 Dividend History
Maintaining a consistent dividend history for 34 years, Kimco Realty is a testament to dividend stability. Sustained dividend payments not only appeal to conservative investors but also reinforce the company's commitment to returning capital to shareholders.
| Year | Dividend per Share (USD) |
|---|---|
| 2025 | 0.50 |
| 2024 | 0.97 |
| 2023 | 1.02 |
| 2022 | 0.84 |
| 2021 | 0.68 |
📈 Dividend Growth
Dividend growth is pivotal for assessing future income potential. The moderate average growth of -2.83% over five years and 12.57% over three years highlights fluctuating growth, necessitating a focus on strategic planning for sustainable increases.
| Time | Growth |
|---|---|
| 3 years | 12.57% |
| 5 years | -2.83% |
The average dividend growth is -2.83% over five years. This shows moderate but steady dividend growth.
📉 Payout Ratio
The payout ratio provides insight into dividend sustainability. Kimco Realty's payout ratios exceed typical thresholds with 124.69% based on EPS and 68.46% based on Free Cash Flow (FCF), highlighting potential concerns about overextension in maintaining dividend payouts.
| Key Figure | Ratio |
|---|---|
| EPS-based | 124.69% |
| Free Cash Flow-based | 68.46% |
The elevated EPS-based payout ratio of 124.69% suggests potential risks, although the FCF-based ratio of 68.46% offers a nuanced perspective on cash flow adequacy.
💼 Cashflow & Capital Efficiency
Cash flow analysis indicates the company's operational efficiency. Robust free cash flow and earnings yield highlight solid cash generation, but high net debt to EBITDA ratio suggests leverage concerns warranting cautious longer-term investment strategies.
| Year | Free Cash Flow Yield | Earnings Yield | CAPEX to Operating Cash Flow | Stock-based Compensation to Revenue | Free Cash Flow / Operating Cash Flow Ratio | Return on Invested Capital |
|---|---|---|---|---|---|---|
| 2024 | 0.0639 | 0.0261 | 0 | 0 | 1 | 0.0291 |
| 2023 | 0.0815 | 0.0498 | 0 | 0.0185 | 1 | 0.0320 |
| 2022 | 0.0661 | -0.0009 | 0 | 0.0154 | 1 | -0.0088 |
Despite the strong cash flow yields, the elevated leverage metrics imply an increased risk, which should be a central focus for prospective investors evaluating capital efficiency and sustainability.
⚠️ Balance Sheet & Leverage Analysis
Analyzing balance sheet strength is crucial for understanding insolvency risk. Kimco's leverage ratios suggest a moderate leverage position, with room for improving financial flexibility and ensuring stability amidst market shifts.
| Year | Debt-to-Equity | Debt-to-Assets | Debt-to-Capital | Net Debt to EBITDA | Current Ratio | Quick Ratio | Financial Leverage | Interest Coverage |
|---|---|---|---|---|---|---|---|---|
| 2024 | 0.8053 | 0.4224 | 0.4461 | 6.2474 | 0 | 3.5816 | 1.9066 | 2.0438 |
| 2023 | 0.8112 | 0.4228 | 0.4479 | 6.3705 | 0 | 4.9262 | 1.9184 | 2.5531 |
| 2022 | 0.7642 | 0.4079 | 0.4332 | 6.6111 | 197.4816 | 197.4816 | 1.8734 | 2.4930 |
While the company's debt levels suggest a controlled leverage position, near-term financial maneuverability might be constrained by the elevated debt metrics and interest coverage under pressure.
🗣️ Fundamental Strength & Profitability
The evaluation of fundamental strength encompasses gauging profitability margins. While the return on equity and asset metrics indicate operational efficiency, negative margins in prior years show improvements are required to bolster profitability.
| Year | Return on Equity | Return on Assets | Net Margin | EBIT Margin | EBITDA Margin | Gross Margin | R&D to Revenue |
|---|---|---|---|---|---|---|---|
| 2024 | 0.0386 | 0.0202 | 0.2017 | 0.3235 | 0.6199 | 0.6870 | 0 |
| 2023 | 0.0687 | 0.0358 | 0.3669 | 0.5014 | 0.6111 | 0.6878 | 0.0025 |
| 2022 | -0.0013 | -0.0007 | -0.0071 | 0.1569 | 0.6235 | 0.6927 | 0.0020 |
Improved profitability highlights recovery, yet strategic actions are necessary to maintain momentum and address prior underperformance challenges.
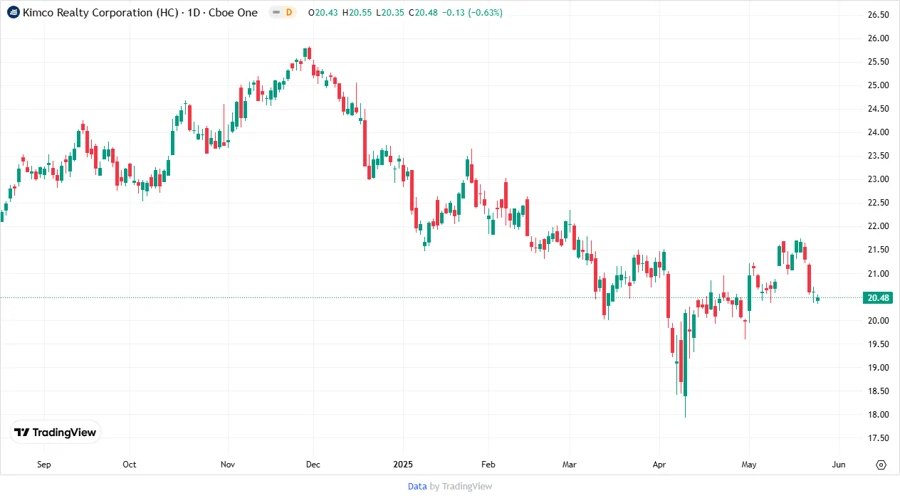
📈 Price Development
✅ Dividend Scoring System
| Criteria | Rating | Score |
|---|---|---|
| Dividend Yield | 4 | |
| Dividend Stability | 5 | |
| Dividend Growth | 2 | |
| Payout Ratio | 2 | |
| Financial Stability | 3 | |
| Dividend Continuity | 5 | |
| Cashflow Coverage | 3 | |
| Balance Sheet Quality | 3 |
Overall Score: 27/40
📝 Rating
Kimco Realty Corporation exhibits robust dividend credentials backed by a stable history. However, the high payout ratio and leveraged balance sheet necessitate vigilance. Investors should weigh the growth potential against associated risks. With a score of 27/40, it presents a moderate investment opportunity requiring diligent monitoring.
Smart Data Insight
Master the Perfect Entry & Exit for this Stock
Don't leave your profits to chance. Historically, this stock follows specific seasonal patterns that institutional traders use to maximize returns.
- ✅ Identify the "Golden Buying Window"
- ✅ Avoid high-risk correction cycles
- ✅ Backtested data from the last 20+ years