May 23, 2026 a 02:03 pm
KHC: Trend and Support & Resistance Analysis - The Kraft Heinz Company
The Kraft Heinz Company shows a mixed performance with notable fluctuations over the analyzed period. The stock is currently in an unclear transition, indicating potential market volatility. Given its global reach, Kraft Heinz remains an essential player in the food and beverage industry, making its stock worth monitoring for potential opportunities.
Trend Analysis
| Date | Closing Price | Trend |
|---|---|---|
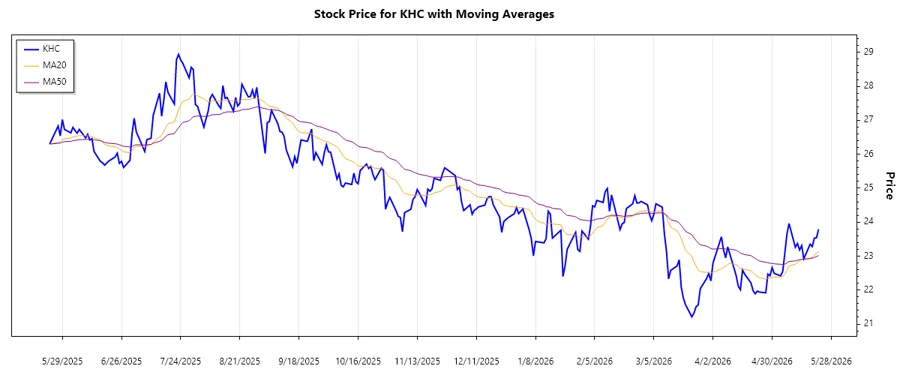
| 2026-05-22 | 23.79 | ▼ Downtrend |
| 2026-05-21 | 23.54 | ▼ Downtrend |
| 2026-05-20 | 23.53 | ▼ Downtrend |
| 2026-05-19 | 23.28 | ▼ Downtrend |
| 2026-05-18 | 23.35 | ▲ Uptrend |
| 2026-05-15 | 22.92 | ▲ Uptrend |
| 2026-05-14 | 23.31 | ▲ Uptrend |
The recent data suggests a decline in the trend with the EMA20 being less than EMA50, showing a slight downtrend. This recent dip indicates investment caution.
Support- and Resistance Analysis
| Zone Type | From | To |
|---|---|---|
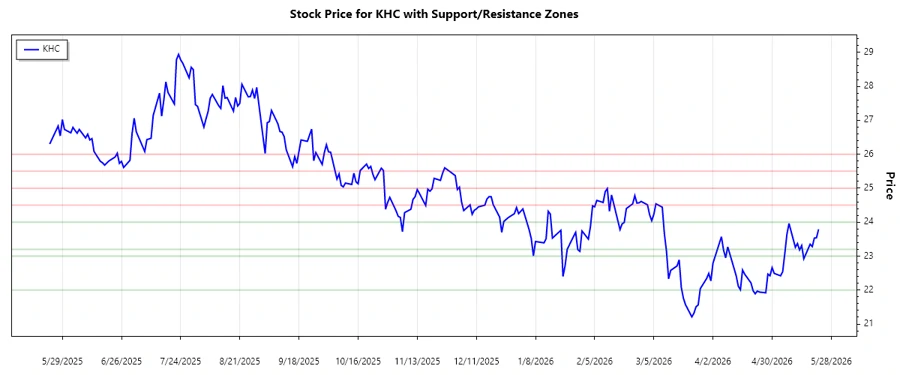
| Support Zone 1 | 22.00 | 23.00 |
| Support Zone 2 | 23.20 | 24.00 |
| Resistance Zone 1 | 24.50 | 25.00 |
| Resistance Zone 2 | 25.50 | 26.00 |
Currently, the stock is hovering around the second support zone, which indicates potential support but also highlights possible risks if the trend continues downward.
Conclusion
The Kraft Heinz Company is currently facing a downward trend with potential support levels in sight. While the overall market position remains solid, the stock's decrease suggests careful monitoring. Investors should be aware of the emerging support levels and manage entries and exits with caution. The company’s broad market presence remains a significant strength, though short-term risks could present a challenge.
Smart Data Insight
Master the Perfect Entry & Exit for this Stock
Don't leave your profits to chance. Historically, this stock follows specific seasonal patterns that institutional traders use to maximize returns.
- ✅ Identify the "Golden Buying Window"
- ✅ Avoid high-risk correction cycles
- ✅ Backtested data from the last 20+ years