May 21, 2026 a 03:15 am
KHC: Trend and Support & Resistance Analysis - The Kraft Heinz Company
The Kraft Heinz Company, a significant player in the global food and beverage industry, has recently demonstrated a reversal in its stock price. With substantial efforts to innovate its product lines and expand into new markets, the company has faced some challenges, especially amidst global economic fluctuations. However, recent data suggests a robust upward trend that might indicate a strong recovery phase. Investors and analysts are closely watching Kraft Heinz's strategic moves to ensure sustained growth while navigating market complexities. The technical analysis below highlights key insights into the stock's current market performance.
Trend Analysis
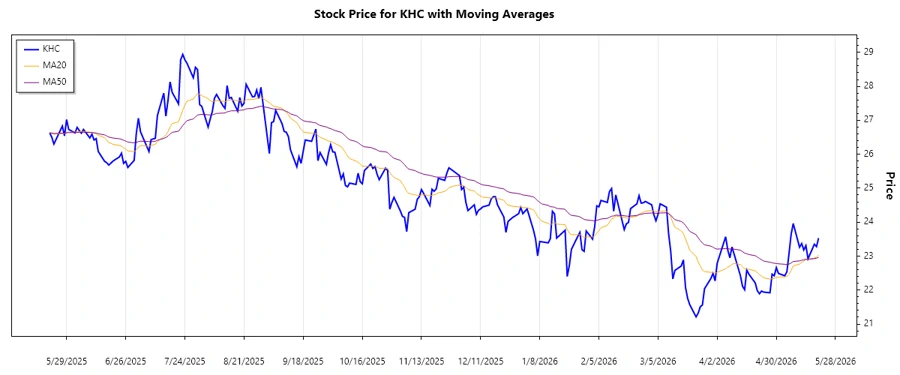
The Kraft Heinz Company's recent stock performance shows a notable shift in trend over the past several months. By calculating the 20-day EMA and 50-day EMA, we reveal key trends:
| Date | Closing Price | Trend |
|---|---|---|
| 2026-05-20 | $23.53 | ▲ |
| 2026-05-19 | $23.28 | ▲ |
| 2026-05-18 | $23.35 | ▲ |
| 2026-05-15 | $22.92 | ▲ |
| 2026-05-14 | $23.31 | ▶️ |
| 2026-05-13 | $23.18 | ▶️ |
| 2026-05-12 | $23.37 | ▶️ |
The technical trend indicates a consistent ▲ upward movement in recent trading days, suggesting a buyer-dominated market state. This momentum, if sustained, may lead to the next resistance challenge for KHC.
Support and Resistance
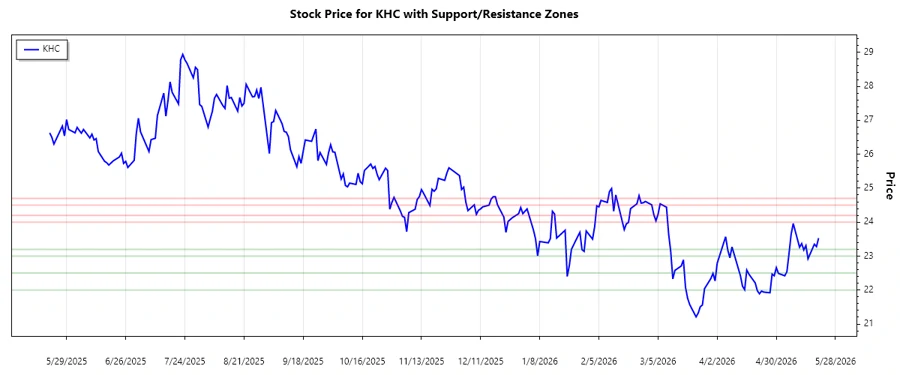
Identifying support and resistance zones from the closing prices:
| Support Zones | Resistance Zones |
|---|---|
| ⚊ $23.00 - $23.20 ⚊ | ⚊ $24.00 - $24.20 ⚊ |
| ⚊ $22.00 - $22.50 ⚊ | ⚊ $24.50 - $24.70 ⚊ |
Currently, the stock is trading above the first support zone but below the first resistance, indicating a consolidation phase with the potential for a breakout.
Conclusion
As Kraft Heinz positions itself to leverage industry opportunities, the upward trend in its stock presents an encouraging sign for investors. With strategic investments, the company's stock could break above the immediate resistance levels, capitalizing on market momentum. However, macroeconomic factors and consumer demand fluctuations remain critical. Hence, continuous monitoring is advised to assess long-term stability.
Smart Data Insight
Master the Perfect Entry & Exit for this Stock
Don't leave your profits to chance. Historically, this stock follows specific seasonal patterns that institutional traders use to maximize returns.
- ✅ Identify the "Golden Buying Window"
- ✅ Avoid high-risk correction cycles
- ✅ Backtested data from the last 20+ years