June 15, 2026 a 05:15 am

KHC: Fibonacci Analysis - The Kraft Heinz Company
The Kraft Heinz Company has been showing resilience in a challenging market for food and beverage products. Recently, the stock has witnessed notable fluctuations within a defined price range, indicating a potential shift in investor sentiment. The company's broad product portfolio coupled with its extensive distribution network renders it a strong player in the industry. With a recent focus on improving operational efficiencies and expanding its e-commerce presence, KHC's stock presents both opportunities for growth and inherent market risks.
Fibonacci Analysis
| Metric | Value |
|---|---|
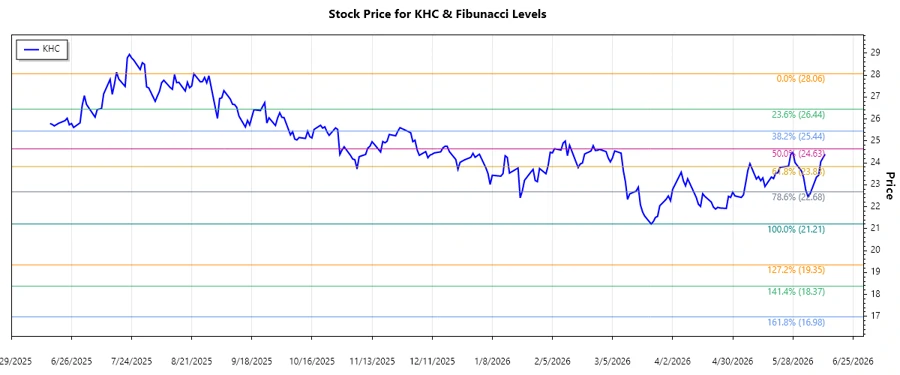
| Trend Start Date | 2025-08-22 |
| Trend End Date | 2026-06-12 |
| High Point Price (Date) | 28.06 (2025-08-22) |
| Low Point Price (Date) | 21.21 (2026-03-23) |
| Fibonacci 0.236 Level | 22.97 |
| Fibonacci 0.382 Level | 23.93 |
| Fibonacci 0.5 Level | 24.63 |
| Fibonacci 0.618 Level | 25.32 |
| Fibonacci 0.786 Level | 26.26 |
| Current Price Analysis | The current price falls within the 0.382 Fibonacci retracement zone, indicating potential support in this area. |
| Technical Interpretation | This retracement could serve as a temporary support level. Observing price action in this area is crucial for future movement prediction. |
Conclusion
The Kraft Heinz Company remains a notable entity within the food and beverage sector, backed by a diverse product lineup and robust global distribution. Despite facing market volatility, its strategic initiatives in operations and e-commerce are commendable strides toward enhancing shareholder value. The Fibonacci analysis highlights a critical support level, offering potential buying opportunities for investors bullish on KHC's future. However, risks remain due to potential market shifts and competitive pressures. It is crucial for stakeholders to closely monitor the stock's performance relative to broader market conditions for informed decision-making.
Smart Data Insight
Master the Perfect Entry & Exit for this Stock
Don't leave your profits to chance. Historically, this stock follows specific seasonal patterns that institutional traders use to maximize returns.
- ✅ Identify the "Golden Buying Window"
- ✅ Avoid high-risk correction cycles
- ✅ Backtested data from the last 20+ years