October 24, 2025 a 06:45 am
KHC: Fibonacci Analysis - The Kraft Heinz Company
The Kraft Heinz Company has shown significant price movements over the past few months. The company, primarily in the food and beverage sector, has experienced fluctuations which are indicative of market pressures and competitive challenges. Its diverse product portfolio and expansive distribution network offer both stability and growth opportunities. However, recent stock behavior suggests investor caution, reflecting broader economic uncertainties.
Fibonacci Analysis
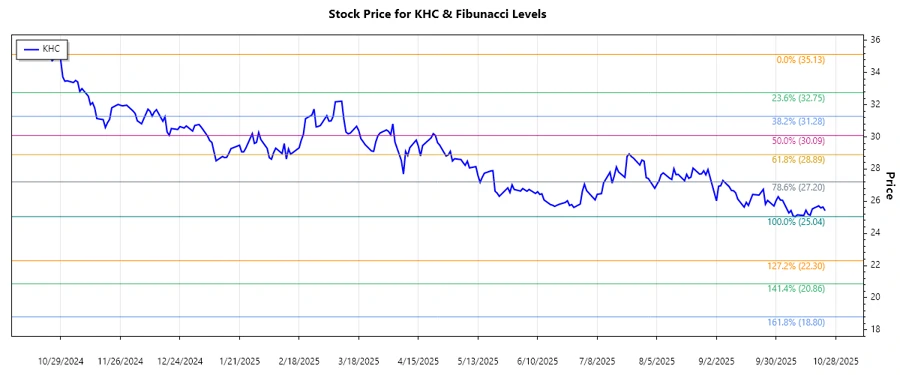
By analyzing the historical price data of KHC, it is evident that the stock experienced a downtrend in the observed period. From a high of $35.13 on 2024-10-28 to a low of $25.04 on 2025-10-09. Based on this trend, we have calculated the Fibonacci retracement levels as follows:
| Trend Start Date | Trend End Date | High Price & Date | Low Price & Date | Fibonacci Level | Price Level |
|---|---|---|---|---|---|
| 2024-10-28 | 2025-10-09 | $35.13 (2024-10-28) | $25.04 (2025-10-09) | 0.236 | $27.66 |
| 0.382 | $29.09 | ||||
| 0.5 | $30.09 | ||||
| 0.618 | $31.08 | ||||
| 0.786 | $32.43 |
The current price of $25.41 is below the lowest Fibonacci retracement level, indicating that it has not retraced yet into a significant Fibonacci level. This placement suggests that the current downtrend remains strong and could potentially reach new support or resistance levels.
Conclusion
The Kraft Heinz Company is in the midst of a significant downtrend. The lack of a Fibonacci retracement indicates a strong downward continuation, presenting a potential risk for short-term investors. However, for long-term market participants, this may present a buying opportunity at lower prices, provided the company's fundamentals remain sound. It is essential for investors to weigh economic indicators and market conditions, as well as internal company metrics, before making financial decisions.
Smart Data Insight
Master the Perfect Entry & Exit for this Stock
Don't leave your profits to chance. Historically, this stock follows specific seasonal patterns that institutional traders use to maximize returns.
- ✅ Identify the "Golden Buying Window"
- ✅ Avoid high-risk correction cycles
- ✅ Backtested data from the last 20+ years