
October 18, 2025 a 10:15 am
KHC: Fibonacci Analysis - The Kraft Heinz Company
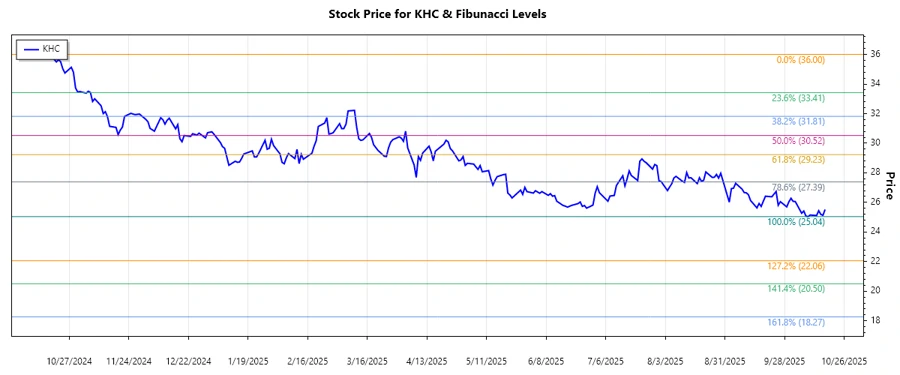
The Kraft Heinz Company has demonstrated fluctuating stock performance over recent months. The trend indicates a dominant downward trajectory, impacting investor sentiment. With its diverse product line and international presence, potential recovery could be influenced by broader market dynamics and consumer demand.
Fibonacci Analysis
| Aspect | Details |
|---|---|
| Trend Duration | From 2024-10-18 to 2025-10-17 |
| High Point | $36 on 2024-10-18 |
| Low Point | $25.04 on 2025-10-09 |
| Fibonacci Levels |
|
| Current Price | $25.52 |
| Retracement Zone | None |
| Technical Interpretation | The current price is below the 0.236 Fibonacci retracement level, indicating a strong resistance at that zone. Monitoring for potential rebounds or further downturns is advisable. |
Conclusion
The Kraft Heinz Company exhibits a pronounced downtrend with potential short-term volatilities. While its diverse product range offers a buffer, the current market conditions and price levels underline the stock's vulnerability to economic shifts. Investors should be cautious, awaiting signs of support at lower Fibonacci levels. For long-term stability, observing consumer trends and international market responses is vital for making informed decisions.
Smart Data Insight
Master the Perfect Entry & Exit for this Stock
Don't leave your profits to chance. Historically, this stock follows specific seasonal patterns that institutional traders use to maximize returns.
- ✅ Identify the "Golden Buying Window"
- ✅ Avoid high-risk correction cycles
- ✅ Backtested data from the last 20+ years