February 17, 2026 a 02:46 am

KHC: Dividend Analysis - The Kraft Heinz Company
The Kraft Heinz Company offers a high dividend yield with a stable payout history of 15 years. Although there have been no recent dividend growths, the company's significant market position and stable cash flows make it a promising choice for income-focused investors seeking steady returns. However, investors should be cautious about its negative EPS payout ratio which might hint at earnings sustainability issues.
📊 Overview
The Kraft Heinz Company operates in the Food & Beverage sector, offering an attractive dividend yield of 6.45% with a current dividend per share of 1.60 USD. Despite a 15-year dividend history, the absence of growth indicates potential challenges ahead. It is noteworthy that there have been no recent cuts or suspensions, showcasing resilience during economic hardships.
| Attribute | Details |
|---|---|
| Sector | Food & Beverage |
| Dividend yield | 6.45% |
| Current dividend per share | 1.60 USD |
| Dividend history | 15 years |
| Last cut or suspension | None |
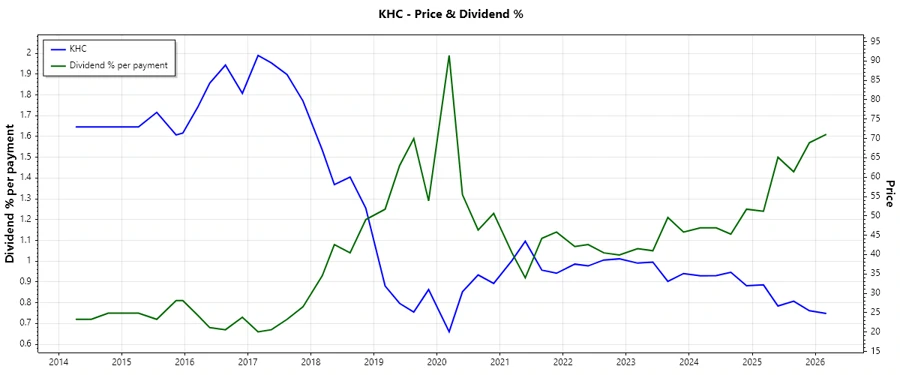
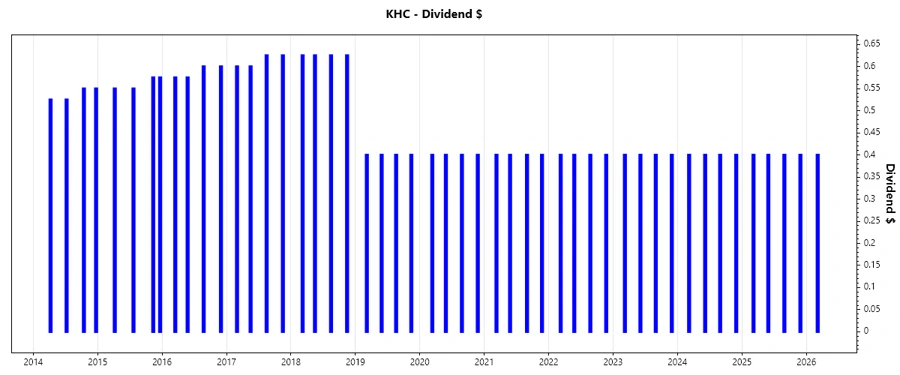
🗣️ Dividend History
A consistent dividend history is crucial for investors as it indicates a company's commitment to returning value to shareholders. The lack of cuts or suspensions over the years highlights The Kraft Heinz Company's dedication to maintaining investor trust. This stability can be vital during economic downturns.
| Year | Dividend Per Share (USD) |
|---|---|
| 2026 | 0.4 |
| 2025 | 1.6 |
| 2024 | 1.6 |
| 2023 | 1.6 |
| 2022 | 1.6 |
📈 Dividend Growth
The analysis of dividend growth rates provides insights into a company's capacity to enhance shareholder value and distribute profits over time. Unfortunately, the absence of growth over the last 3 to 5 years indicates stagnation, reflecting possible restricted financial flexibility.
| Time | Growth |
|---|---|
| 3 years | 0% |
| 5 years | 0% |
The average dividend growth is 0% over 5 years. This shows a lack of dividend growth, which might concern growth-focused investors.
⚖️ Payout Ratio
Payout ratios are crucial for assessing the sustainability of dividends. The Kraft Heinz Company exhibits a negative EPS-based payout ratio of -32.47%, suggesting that dividends exceed income, which poses long-term unsustainability risks. However, a positive FCF-based payout ratio of 52.13% indicates that dividends are supported by cash flows.
| Key Figure | Ratio |
|---|---|
| EPS-based | -32.47% |
| Free cash flow-based | 52.13% |
The negative EPS payout ratio highlights potential risks, but the FCF payout ratio supports the dividend's current sustainability.
🚀 Cashflow & Capital Efficiency
Efficient cash flow management and capital usage are critical for supporting dividend payments and understanding overall financial health. The Free Cash Flow Yield of 12.37% is promising, but negative Earnings Yield and other metrics highlight financial stress.
| Year | 2025 | 2024 | 2023 |
|---|---|---|---|
| Free Cash Flow Yield | 12.38% | 8.51% | 6.53% |
| Earnings Yield | -19.86% | 7.39% | 6.29% |
| CAPEX to Operating Cash Flow | 18.84% | 24.47% | 25.48% |
| Stock-based Compensation to Revenue | 0.38% | 0.42% | 0.53% |
| Free Cash Flow / Operating Cash Flow Ratio | 82.05% | 75.53% | 74.52% |
The negative earnings yield indicates possible profitability issues, impacting long-term dividend viability.
📉 Balance Sheet & Leverage Analysis
The balance sheet provides insights into financial stability and leverage. The Debt-to-Equity and Debt-to-Assets ratios indicate moderate debt levels, while negative Net Debt to EBITDA suggests considerable leveraged financial risk.
| Year | 2025 | 2024 | 2023 |
|---|---|---|---|
| Debt-to-Equity | 46.35% | 40.40% | 40.45% |
| Debt-to-Assets | 23.61% | 22.51% | 22.17% |
| Debt-to-Capital | 31.67% | 28.77% | 28.80% |
| Net Debt to EBITDA | -4.73 | 6.82 | 3.38 |
| Current Ratio | 1.15 | 0 | 0 |
| Quick Ratio | 0.79 | 0.59 | 0.54 |
| Financial Leverage | 1.96 | 1.79 | 1.82 |
The moderate leverage metrics suggest cautious optimism towards The Kraft Heinz Company's ability to handle its debt obligations.
🥇 Fundamental Strength & Profitability
Review of Return on Equity (ROE) and Margins highlights how effectively the company utilizes equity and controls costs. Negative values in certain margins indicate areas needing performance improvements.
| Year | 2025 | 2024 | 2023 |
|---|---|---|---|
| Return on Equity | -14.03% | 5.58% | 5.76% |
| Return on Assets | -7.15% | 3.11% | 3.16% |
| Margins: Net | -23.44% | 10.62% | 10.72% |
| EBIT Margin | -18.03% | 6.84% | 17.06% |
| EBITDA Margin | -14.15% | 10.51% | 20.67% |
| Gross Margin | 33.31% | 34.70% | 33.51% |
| Research & Development to Revenue | 0% | 0% | 0% |
While the net and EBIT margins show some profitability, improvements are essential for long-term strength.
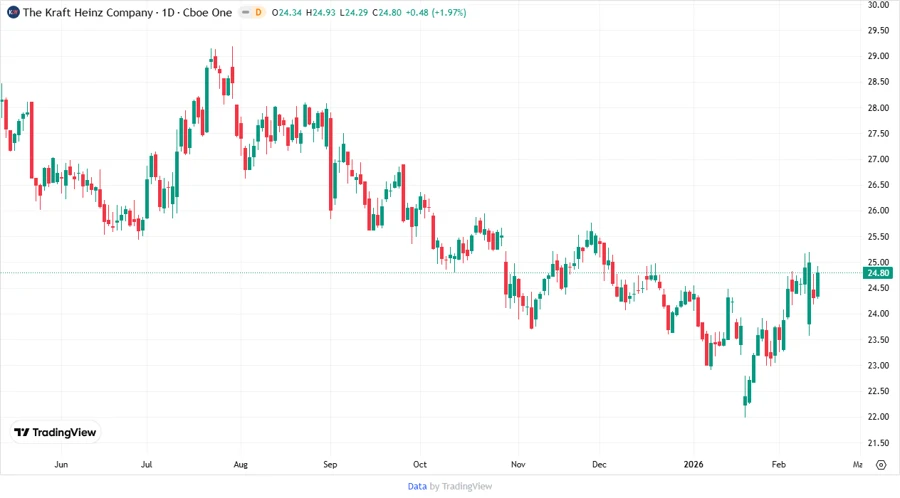
📊 Price Development
💼 Dividend Scoring System
The scoring system evaluates The Kraft Heinz Company's dividend-related qualities across critical areas.
| Category | Score (1-5) | Score Bar |
|---|---|---|
| Dividend yield | 4 | |
| Dividend Stability | 3 | |
| Dividend growth | 1 | |
| Payout ratio | 2 | |
| Financial stability | 3 | |
| Dividend continuity | 4 | |
| Cashflow Coverage | 3 | |
| Balance Sheet Quality | 3 |
Total Score: 23/40
🛈 Rating
Overall, The Kraft Heinz Company presents a mixed dividend profile. With an attractive yield and long-term payout stability, it remains a viable option for income investors. However, stagnant dividend growth and negative earnings questions long-term dividend sustainability. Investor caution is advised, but the potential for recovery in fundamentals could present growth opportunities.