September 08, 2025 a 03:32 am
KHC: Dividend Analysis - The Kraft Heinz Company
The Kraft Heinz Company exhibits a robust dividend profile with a notable yield of 5.72%. Despite a lack of recent dividend growth, the company's consistent payout over 14 years underscores its commitment to providing shareholder value. However, investors should be cautious of the high payout ratios and an absence of growth indicating potential constraints on future increases.
📊 Overview
| Attribute | Details |
|---|---|
| Sector | Consumer Packaged Goods |
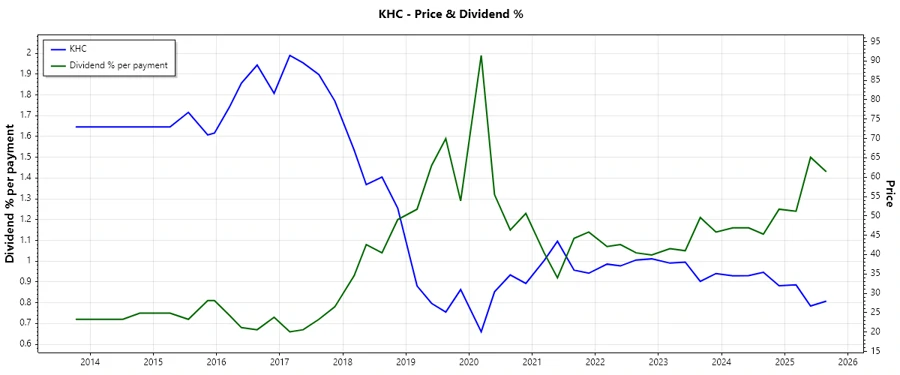
| Dividend yield | 5.72 % |
| Current dividend per share | 1.60 USD |
| Dividend history | 14 years |
| Last cut or suspension | None |
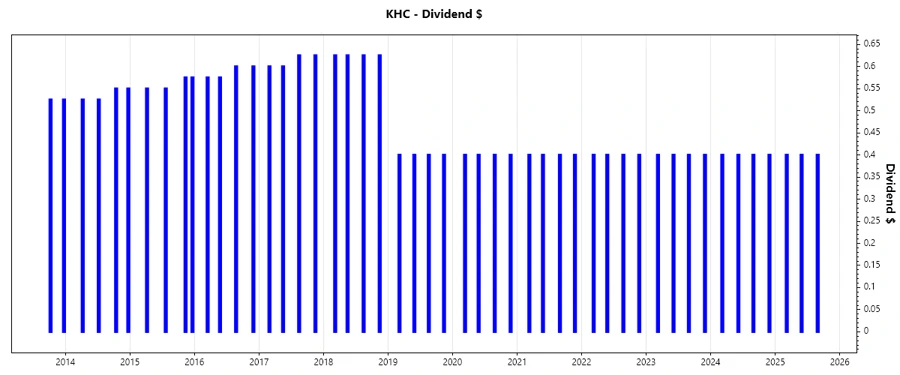
🗣️ Dividend History
The history of dividends from Kraft Heinz illuminates a steady payout strategy over the years, reflecting the company's focus on shareholder return. Regular dividends are a signal of financial health and reliability in payouts.
| Year | Dividend Per Share (USD) |
|---|---|
| 2025 | 1.20 |
| 2024 | 1.60 |
| 2023 | 1.60 |
| 2022 | 1.60 |
| 2021 | 1.60 |
📈 Dividend Growth
Despite a strong dividend history, Kraft Heinz has not demonstrated significant growth in its dividend payments over the past three and five years. This static growth could imply future financial strategy shifts.
| Time | Growth |
|---|---|
| 3 years | 0 % |
| 5 years | 0 % |
The average dividend growth is 0 % over 5 years. This shows a lack of dividend increase, hinting at financial constraints or reinvestment strategies.
✅ Payout Ratio
The payout ratios are critical indicators of a company’s dividend sustainability. Kraft Heinz’s negative EPS-based payout ratio alongside a moderate FCF-based payout ratio denotes potential earnings challenges, yet a stable cash flow to support dividends.
| Key figure | Ratio |
|---|---|
| EPS-based | -36.03 % |
| Free cash flow-based | 54.06 % |
The negative EPS payout ratio is concerning, hinting at profitability issues, whereas the FCF-based ratio demonstrates adequate cash buffer for dividends.
💵 Cashflow & Capital Efficiency
Healthy cash flow and capital efficiency are vital for sustaining growth and funding dividends. The metrics show moderate capital efficiency with a reasonable free cash flow yield.
| Year | 2024 | 2023 | 2022 |
|---|---|---|---|
| Free Cash Flow Yield | 0.085 | 0.065 | 0.031 |
| Earnings Yield | 0.074 | 0.063 | 0.047 |
| CAPEX to Operating Cash Flow | 0.245 | 0.255 | 0.371 |
| Stock-based Compensation to Revenue | 0.0042 | 0.0053 | 0.0056 |
| Free Cash Flow / Operating Cash Flow Ratio | 0.755 | 0.745 | 0.629 |
The cash flow metrics indicate a stable generation of free cash but also show an increased dependency on operating cash flow maintenance.
📊 Balance Sheet & Leverage Analysis
The balance sheet ratios give insights into the company's leverage and financial health. Continued stability in debt ratios suggests manageable leverage levels.
| Year | 2024 | 2023 | 2022 |
|---|---|---|---|
| Debt-to-Equity | 0.404 | 0.404 | 0.412 |
| Debt-to-Assets | 0.225 | 0.222 | 0.222 |
| Debt-to-Capital | 0.288 | 0.288 | 0.292 |
| Net Debt to EBITDA | 6.824 | 3.384 | 3.948 |
| Current Ratio | 1.072 | 0.987 | 0.875 |
| Quick Ratio | 0.590 | 0.537 | 0.470 |
| Financial Leverage | 1.795 | 1.824 | 1.859 |
The financial stability is evident from relatively steady leverage ratios, although attention should be turned towards the increasing Net Debt to EBITDA ratio.
⚠️ Fundamental Strength & Profitability
The core strength and profitability ratios measure operational efficiency and financial soundness, crucial for sustainable growth and dividend payments.
| Year | 2024 | 2023 | 2022 |
|---|---|---|---|
| Return on Equity | 5.58 % | 5.76 % | 4.85 % |
| Return on Assets | 3.11 % | 3.16 % | 2.61 % |
| Margins: Net | 10.61 % | 10.72 % | 8.92 % |
| Margins: EBIT | 6.84 % | 17.06 % | 14.68 % |
| Margins: EBITDA | 10.51 % | 20.67 % | 18.20 % |
| Margins: Gross | 34.70 % | 33.51 % | 30.67 % |
| Research & Development to Revenue | 0 % | 0.55 % | 0 % |
The operational margin improvement over the years reflects enhanced cost efficiency, though returns on equity and assets remain limited, impacting overall profitability.
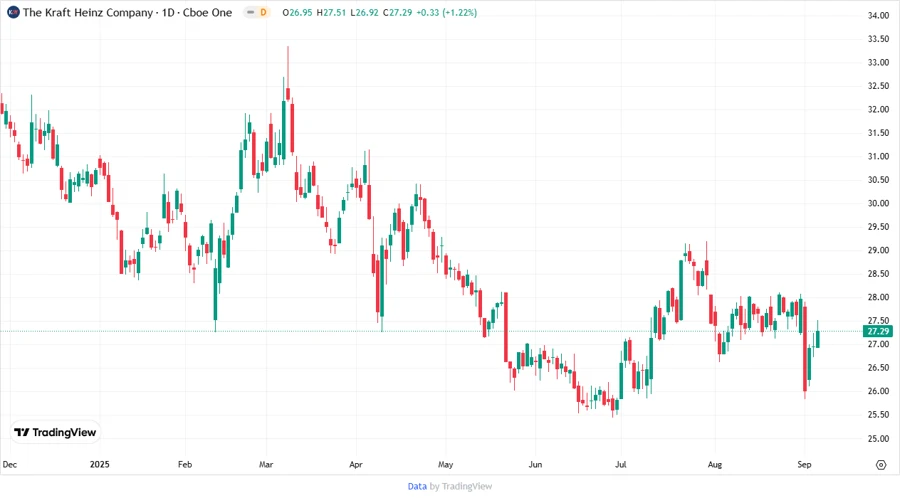
📉 Price Development
✅ Dividend Scoring System
| Criteria | Score | Score Bar |
|---|---|---|
| Dividend yield | 4 | |
| Dividend Stability | 4 | |
| Dividend growth | 1 | |
| Payout ratio | 2 | |
| Financial stability | 3 | |
| Dividend continuity | 3 | |
| Cashflow Coverage | 3 | |
| Balance Sheet Quality | 3 |
Total Score: 23 out of 40
🗣️ Rating
The Kraft Heinz Company shows a stable dividend yield with consistent, albeit stagnant, dividend payments. The company maintains adequate cash flow but faces challenges in growth and profitability, suggesting a cautious approach is warranted for income-focused investors.
Smart Data Insight
Master the Perfect Entry & Exit for this Stock
Don't leave your profits to chance. Historically, this stock follows specific seasonal patterns that institutional traders use to maximize returns.
- ✅ Identify the "Golden Buying Window"
- ✅ Avoid high-risk correction cycles
- ✅ Backtested data from the last 20+ years