December 11, 2025 a 06:44 am

KEY: Fibonacci Analysis - KeyCorp
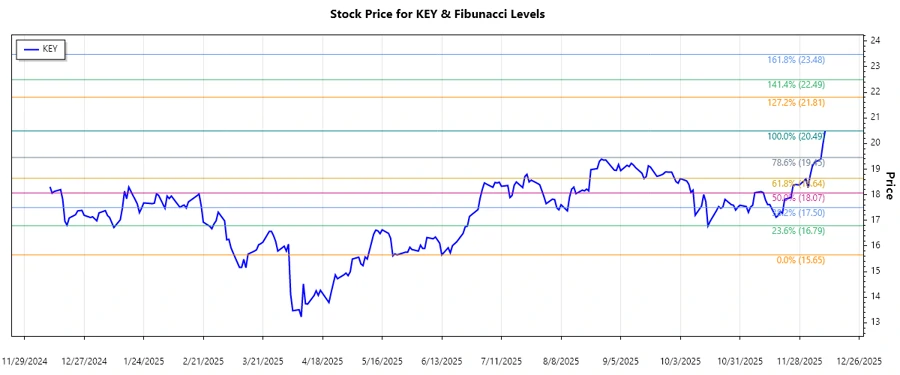
KeyCorp, represented by the ticker KEY, has shown significant movements over the past months. Known for its strong presence in the financial sector, KeyCorp offers diverse banking products and services. Recently, the stock demonstrated an uptrend from mid-2025, reflecting investor confidence partly due to strategic operations and expansions. The analysis further explores Fibonacci retracement levels to interpret potential future movements.
Fibonacci Analysis
| Trend Period | High Date | High Price | Low Date | Low Price |
|---|---|---|---|---|
| June 2025 - December 2025 | 2025-12-10 | $20.49 | 2025-06-18 | $15.65 |
| Level | Price |
|---|---|
| 0.236 | $19.32 |
| 0.382 | $18.68 |
| 0.5 | $18.07 |
| 0.618 | $17.46 |
| 0.786 | $16.60 |
The current price of KeyCorp's stock sits within the 0.382 retracement zone at $19.39, suggesting a potential bullish support area.
Conclusion
The recent upswing in KeyCorp's stock highlights robust market performance with an evident uptrend since mid-2025. While the stock now finds itself within a significant Fibonacci retracement level, a bounce above this could indicate forthcoming upward momentum. However, failure to hold this support might shift the trend toward bearish pressures. For analysts, maintaining vigilance on price actions around these levels could yield substantial trade opportunities.