October 13, 2025 a 04:45 pm
KEY: Fibonacci Analysis - KeyCorp
KeyCorp, symbol KEY, operates as a financial holding company managing KeyBank. The company offers a broad spectrum of retail and commercial banking services in the U.S. Recent analysis indicates KeyCorp's stock showed a downward trend in the observed period. Using technical analysis through Fibonacci Retracement levels, the analysis will provide insight into potential support and resistance scenarios. Overall, an understanding of the current trend can help in making informed investment decisions.
Fibonacci Analysis
| Detail | Information |
|---|---|
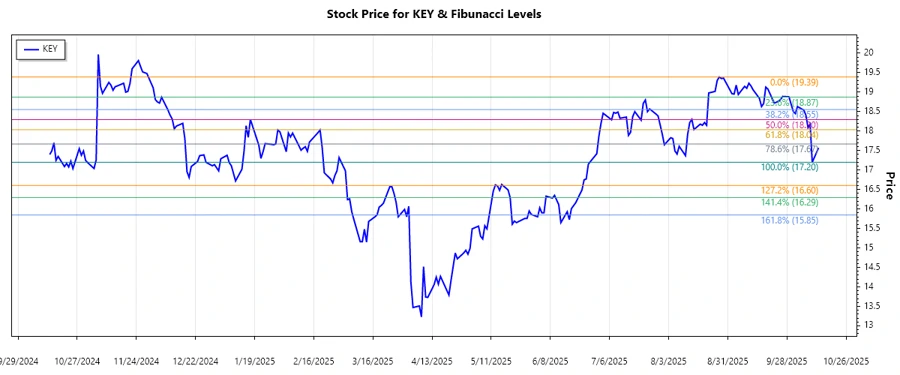
| Trend Period | 2025-08-28 to 2025-10-13 |
| Highest Price | $19.39 on 2025-08-27 |
| Lowest Price | $17.2 on 2025-10-10 |
| Fibonacci Level | Price Level |
|---|---|
| 0.236 | $18.80 |
| 0.382 | $18.45 |
| 0.5 | $18.29 |
| 0.618 | $18.13 |
| 0.786 | $17.88 |
Current Price: $17.57. The stock is below the 0.786 retracement level, suggesting it is out of a common retracement zone, indicating potential support at current levels.
Technically, this could imply a possible support level, with the stock potentially finding a base for future upward movement.
Conclusion
As KeyCorp's stock showcased a downward trend in the observed period, it signifies potential risks associated with declining price momentum. Investors should be mindful of the existing financial climate and market conditions that can either favor or hinder performance. Understanding Fibonacci retracement levels provides insight into potential support zones; however, it is crucial to consider other market factors and company fundamentals. The stock's downward movement past the common retracement zones marks a caution sign, yet the levels calculated here are essential for strategizing possible entry points. Exploring such trends helps technical analysts in defining support levels, while traders might use these insights to await reversal patterns for improved positions.
Smart Data Insight
Master the Perfect Entry & Exit for this Stock
Don't leave your profits to chance. Historically, this stock follows specific seasonal patterns that institutional traders use to maximize returns.
- ✅ Identify the "Golden Buying Window"
- ✅ Avoid high-risk correction cycles
- ✅ Backtested data from the last 20+ years