August 11, 2025 a 03:15 pm
KEY: Fibonacci Analysis - KeyCorp
KeyCorp has seen significant price movements over the past months. The stock has demonstrated resilience, and recent data suggests a gradual recovery following a previous decline. KeyCorp's diverse banking operations provide stability, and there appears to be potential for further growth if the recovery sustains. This optimistic outlook hinges on broader economic factors and the company's strategic initiatives.
Fibonacci Analysis
| Detail | Information |
|---|---|
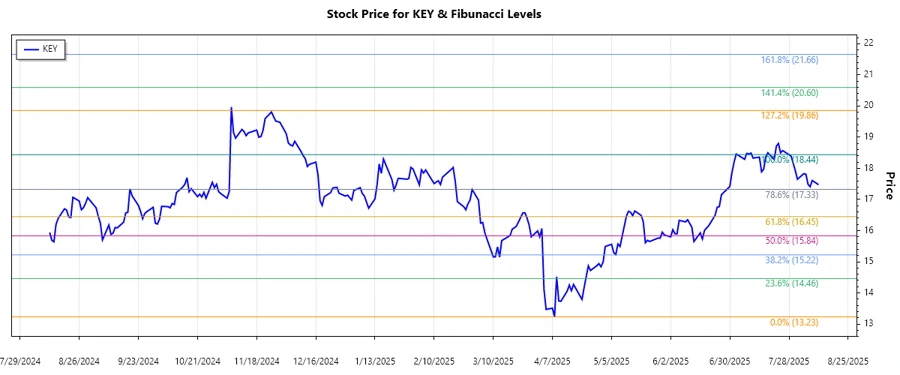
| Trend Period | April 8, 2025 - July 28, 2025 |
| High Point | $18.44 on July 28, 2025 |
| Low Point | $13.23 on April 8, 2025 |
Fibonacci Retracement Levels
| Level | Price |
|---|---|
| 0.236 | $14.42 |
| 0.382 | $15.34 |
| 0.5 | $15.84 |
| 0.618 | $16.34 |
| 0.786 | $17.09 |
The current price of KeyCorp is at $17.475, which falls into the 0.786 retracement level, suggesting a potential resistance level.
Generally, the 0.786 level is a significant barrier and a potential reversal zone. Breaking this level could signal a continuation of the uptrend, while a failure might result in a pullback.
Conclusion
KeyCorp is on a recovery path, showing strength after a challenging period. Analysts see the 0.786 Fibonacci level as pivotal; surpassing this could signal significant upward momentum. However, caution is advised as failure to break through may result in consolidation or decline. Investors should watch broader market conditions as they will heavily influence KeyCorp's stock performance. Opportunities exist for gains, but risks of market volatility and economic downturns are persistent. Overall, strategic investments and a positive outlook on economic conditions could support the stock's upward trajectory.
Smart Data Insight
Master the Perfect Entry & Exit for this Stock
Don't leave your profits to chance. Historically, this stock follows specific seasonal patterns that institutional traders use to maximize returns.
- ✅ Identify the "Golden Buying Window"
- ✅ Avoid high-risk correction cycles
- ✅ Backtested data from the last 20+ years