August 05, 2025 a 06:44 amhtml
KEY: Fibunacci Analysis - KeyCorp
KeyCorp has shown significant volatility over the past few months. The chart indicates a notable upward trend starting from mid-June to the present, highlighting investor confidence in its broad range of banking services. While this reflects a short-term bullish sentiment, macroeconomic factors and market conditions pose potential challenges.
Fibonacci Analysis
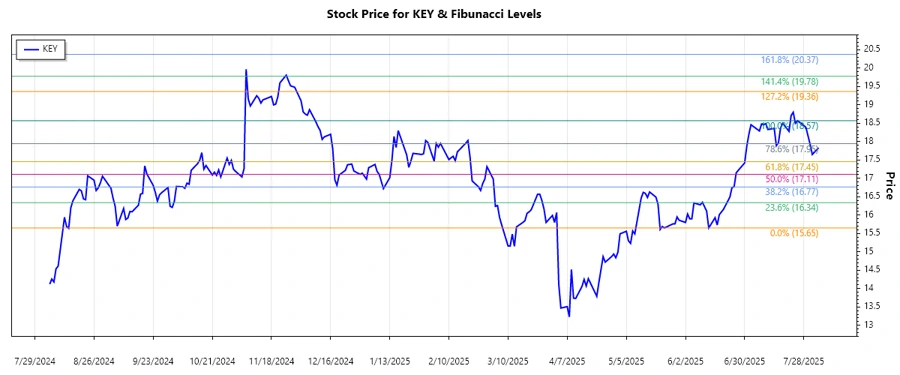
Analyzing the data for KeyCorp, a significant upward trend is observed from June 16, 2025, with a low price of $15.65, peaking on July 28, 2025, at $18.57. Using these points, the Fibonacci retracement levels have been calculated to gauge potential support and resistance levels.
| Trend Period | High Price | Low Price | Current Price | Fibonacci Levels |
|---|---|---|---|---|
| June 16, 2025 - August 4, 2025 | $18.57 (July 28, 2025) | $15.65 (June 16, 2025) | $17.83 (August 4, 2025) |
|
The current price of $17.83 is within the 0.236 retracement zone, suggesting a mild pullback. This is technically seen as an early sign of possible support, but if breached, might pave the way to test lower levels, such as the 0.382 retracement.
Conclusion
KeyCorp shares have experienced an upward swing, reflecting potential investor optimism. The present price within the early retracement zone suggests cautious optimism with room for further movement either upwards or toward deeper retracement levels. An investor's outlook should balance between KeyCorp's strong banking sector presence and external factors influencing the market landscape. A clear break above the 0.236 level may foster bullish confidence, whereas breaches below could indicate heightened volatility.
Smart Data Insight
Master the Perfect Entry & Exit for this Stock
Don't leave your profits to chance. Historically, this stock follows specific seasonal patterns that institutional traders use to maximize returns.
- ✅ Identify the "Golden Buying Window"
- ✅ Avoid high-risk correction cycles
- ✅ Backtested data from the last 20+ years