July 20, 2025 a 11:44 am
KEY: Fibonacci Analysis - KeyCorp
KeyCorp has demonstrated noteworthy performance, reflecting its robust banking operations across the Consumer and Commercial Bank segments. The company's extensive branch network and diverse financial services portfolio underline its market position. Recent price movements indicate a trend reversal potential, necessitating a technical analysis approach to anticipate future price action.
Fibonacci Analysis
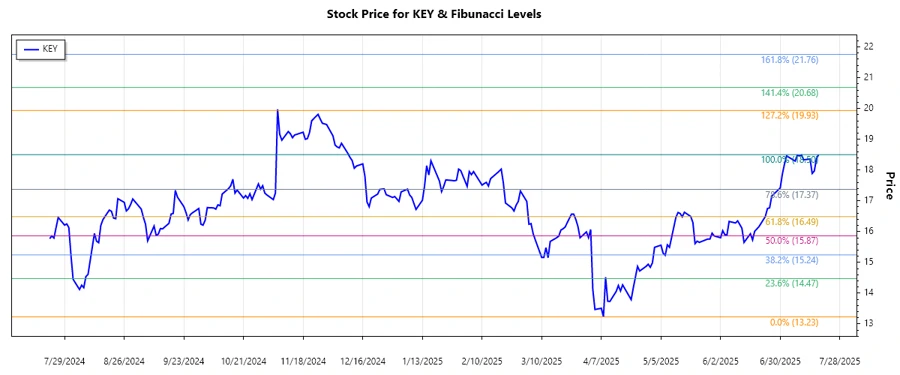
The analysis period shows a clear uptrend, starting in early April 2025 and extending into mid-July 2025. The calculated Fibonacci retracement levels suggest potential support or resistance areas. Presently, KeyCorp's stock price remains just above the 0.382 retracement level, potentially indicating a consolidation phase.
| Factor | Information | ||||||||||||
|---|---|---|---|---|---|---|---|---|---|---|---|---|---|
| Trend Start Date | 2025-04-01 | ||||||||||||
| Trend End Date | 2025-07-18 | ||||||||||||
| High Price | $18.50 on 2025-07-18 | ||||||||||||
| Low Price | $13.23 on 2025-04-08 | ||||||||||||
| Fibonacci Levels |
|
||||||||||||
| Current Price | $18.50 | ||||||||||||
| Retracement Zone | Near 0.236 | ||||||||||||
| Interpretation | The retracement indicates potential support, suggesting a bullish continuation pattern. |
Conclusion
The Fibonacci analysis indicates that KeyCorp's stock price is hovering around a significant support level, with implications of a continuing upward trend. The strength in the financial metrics suggests potential resilience in the face of market corrections. However, external economic factors could play a crucial role in driving future price actions, warranting cautious optimism. For analysts, this reflects a potential long position opportunity, provided the broader market conditions remain favorable. Despite the positive indicators, investors should remain vigilant about any rapid shifts in market sentiment.
Smart Data Insight
Master the Perfect Entry & Exit for this Stock
Don't leave your profits to chance. Historically, this stock follows specific seasonal patterns that institutional traders use to maximize returns.
- ✅ Identify the "Golden Buying Window"
- ✅ Avoid high-risk correction cycles
- ✅ Backtested data from the last 20+ years