
June 26, 2026 a 12:46 pm

KEY: Dividend Analysis - KeyCorp
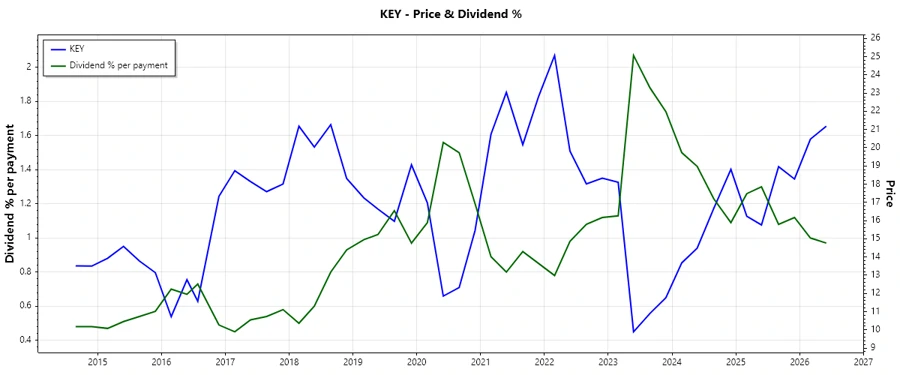
KeyCorp presents a robust dividend profile with consistent payouts over the years. With a dividend yield of 3.87%, it underscores its commitment to returning value to shareholders. Despite recent challenges, the firm has demonstrated resilience in maintaining dividend stability.
📊 Overview
Providing a reliable dividend history and maintaining a solid yield, KeyCorp remains a notable player in its sector. Its strategic positioning in the financial industry has allowed for steady dividends.
| Key Aspect | Details |
|---|---|
| Sector | Financials |
| Dividend Yield | 3.87 % |
| Current Dividend per Share | 0.962 USD |
| Dividend History | 40 years |
| Last Cut or Suspension | None |
🗣️ Dividend History
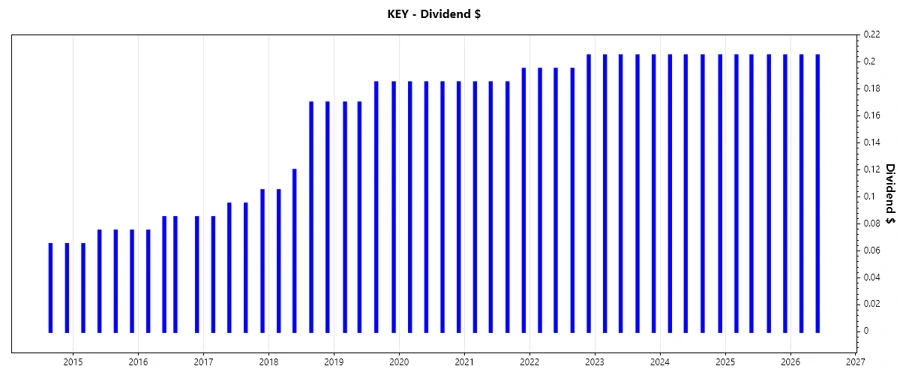
KeyCorp has managed to uphold its dividends through various economic cycles, providing investors with reassurance of its commitment to payouts. This long-standing tradition is a testament to its financial stability and strategic foresight.
| Year | Dividend per Share (USD) |
|---|---|
| 2026 | 0.410 |
| 2025 | 0.820 |
| 2024 | 0.820 |
| 2023 | 0.820 |
| 2022 | 0.790 |
📈 Dividend Growth
The dividend growth rate is indicative of the company's strategic emphasis on increasing shareholder value. With modest yet persistent increases, KeyCorp showcases its ability to enhance returns progressively.
| Time | Growth |
|---|---|
| 3 years | 1.25 % |
| 5 years | 2.07 % |
The average dividend growth is 2.07 % over 5 years. This shows moderate but steady dividend growth.
🔍 Payout Ratio
Assessing the payout ratio provides insights into the sustainability of dividends. KeyCorp's metrics suggest a balanced approach, maintaining payouts within earnings and cash flow constraints.
| Key Figure | Ratio |
|---|---|
| EPS-based | 53.62 % |
| Free Cash Flow-based | 47.72 % |
The payout ratio of 53.62 % based on EPS and 47.72 % based on free cash flow indicates a sustainable dividend policy relative to the company’s profitability and cash flow generation.
📉 Cashflow & Capital Efficiency
Robust cash flow metrics and efficient capital utilization are crucial for sustaining dividends and facilitating growth investments. KeyCorp demonstrates strong cash flow yields and prudent capital management.
| Year | 2023 | 2024 | 2025 |
|---|---|---|---|
| Free Cash Flow Yield | 20.68 % | 3.68 % | 9.29 % |
| Earnings Yield | 7.24 % | -0.99 % | 8.09 % |
| CAPEX to Operating Cash Flow | 4.89 % | 9.78 % | 4.85 % |
| Stock-based Compensation to Revenue | 1.18 % | 1.15 % | 1.18 % |
| Free Cash Flow / Operating Cash Flow Ratio | 95.15 % | 90.21 % | 95.15 % |
KeyCorp's cash flow metrics suggest robust profitability and prudent capital allocation strategies, supporting ongoing dividends and potential growth opportunities.
🏛️ Balance Sheet & Leverage Analysis
Examining leverage ratios and balance sheet strengths are essential in evaluating financial stability. KeyCorp shows balanced debt levels and sufficient liquidity to meet its obligations.
| Metric | 2023 | 2024 | 2025 |
|---|---|---|---|
| Debt-to-Equity | 154.71 % | 78.39 % | 53.98 % |
| Debt-to-Assets | 12.03 % | 7.61 % | 5.97 % |
| Debt-to-Capital | 60.74 % | 43.94 % | 35.05 % |
| Net Debt to EBITDA | 16.52 | -53.67 | 4.18 |
| Current Ratio | 0.35 | 0.17 | 0.77 |
| Quick Ratio | 0.35 | 0.17 | 0.77 |
| Financial Leverage | 12.86 | 10.30 | 9.05 |
KeyCorp maintains financial health through strategic leverage management and solid liquidity positions, facilitating sustained dividend payments.
🔬 Fundamental Strength & Profitability
Strong fundamentals and profitability ratios are indicative of a company's operational efficiency and financial health. KeyCorp consistently shows resilience in these metrics.
| Metric | 2023 | 2024 | 2025 |
|---|---|---|---|
| Return on Equity | 6.61 % | -0.89 % | 8.97 % |
| Return on Assets | 0.51 % | -0.09 % | 0.99 % |
| Margins: Net | 9.45 % | -1.78 % | 16.35 % |
| Margins: EBIT | 11.34 % | -3.38 % | 20.59 % |
| Margins: EBITDA | 12.84 % | -2.57 % | 20.75 % |
| Margins: Gross | 55.98 % | 44.82 % | 62.27 % |
| R&D to Revenue | 0.00 % | 0.00 % | 0.00 % |
Despite economic fluctuations, KeyCorp's profit margins and return metrics have shown notable recovery, indicative of strong management and operational practices.
📈 Price Development
✅ Dividend Scoring System
| Attribute | Score | Score Bar |
|---|---|---|
| Dividend Yield | 4 | |
| Dividend Stability | 5 | |
| Dividend Growth | 3 | |
| Payout Ratio | 4 | |
| Financial Stability | 3 | |
| Dividend Continuity | 5 | |
| Cashflow Coverage | 4 | |
| Balance Sheet Quality | 3 |
Total Score: 31/40
🏁 Rating
In conclusion, KeyCorp exhibits a strong dividend profile characterized by reliability and growth potential. Its financial metrics support continued dividend disbursement, positioning it as a favorable investment choice for dividend-seeking investors.
Smart Data Insight
Master the Perfect Entry & Exit for this Stock
Don't leave your profits to chance. Historically, this stock follows specific seasonal patterns that institutional traders use to maximize returns.
- ✅ Identify the "Golden Buying Window"
- ✅ Avoid high-risk correction cycles
- ✅ Backtested data from the last 20+ years